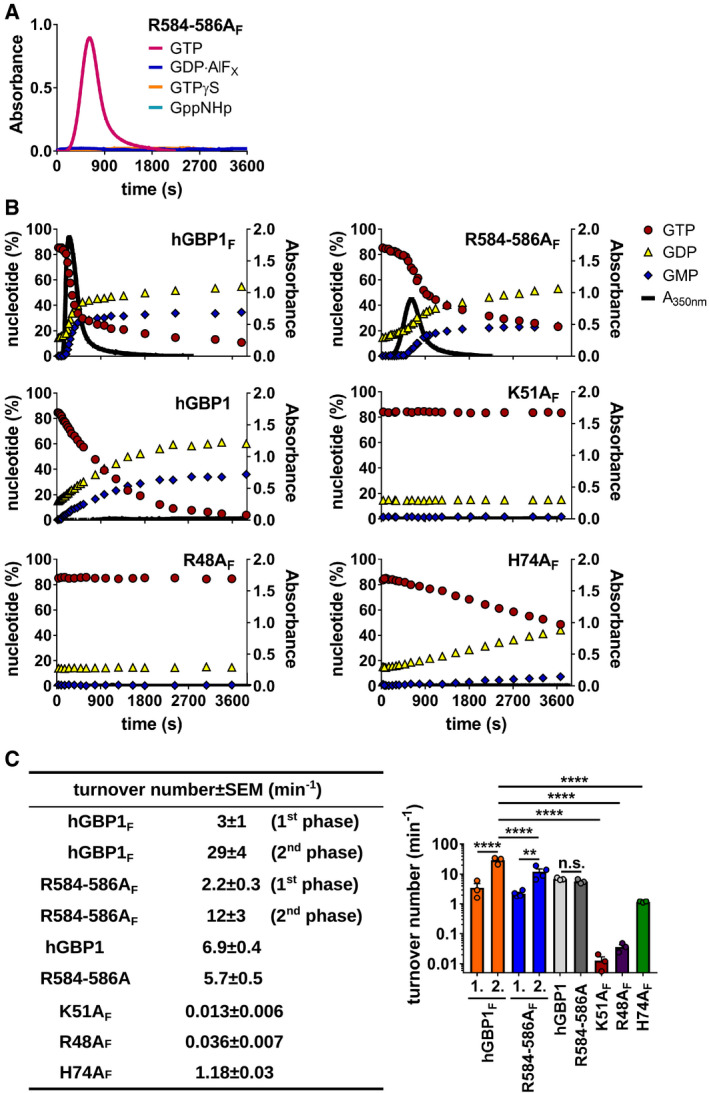
Figure EV2. hGBP1F polymerization is dependent on GTP, and subsequent GDP hydrolysis and its dynamics are modified by the C‐terminal 3R stretch.

-
APolymerization of 10 μM hGBP1F R584‐586A was monitored over time by absorption spectroscopy at 350 nm after admixture of 2 mM (GTP, GppNHp, GTPγS) or 250 μM (GDP·AlFX) nucleotide.
-
BPolymerization of different hGBP1 variants (at 10 μM) induced by 2 mM GTP was monitored over time by absorption spectroscopy at 350 nm. Absorbance signals were superimposed with nucleotide composition analyzed at defined time points of the corresponding sample. Blots for hGBP1F and hGBP1F R584‐586A are the same as shown in Fig 3A.
-
CGTP turnover numbers were determined for different hGBP1 variants. Turnover numbers for both the slow and the fast phases of GTP hydrolysis (1st phase [1.], 2nd phase [2.]) were quantified during hGBP1F and hGBP1F R584‐586A polymerization. Combined data from three independent experiments are shown as mean turnover numbers ± SEM. Significance was determined by two‐way ANOVA with Tukey's multiple comparison test. n.s., not significant; **P ≤ 0.01; ****P ≤ 0.0001.
Source data are available online for this figure.
