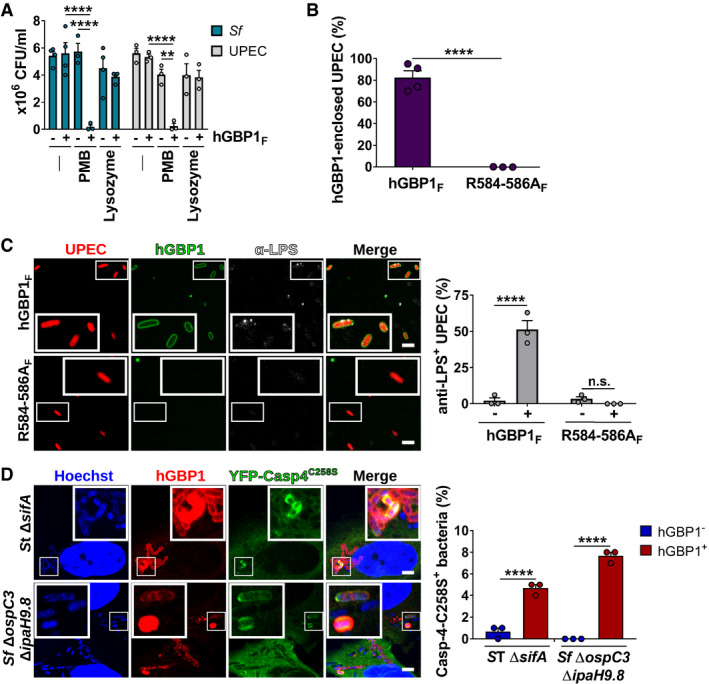
Figure 6. Binding of hGBP1F to bacteria disrupts the O‐antigen barrier function.

-
AFollowing incubation for 1.5 h with buffer in the absence or presence of 10 μM hGBP1F and 5 mM GTP, live bacteria were treated with antibiotics (2.5 μg/ml PMB or 5 mg/ml lysozyme) for 30 min or left untreated. The number of viable bacteria was subsequently determined by colony‐forming unit (CFU) counts. Graphs show mean CFUs ± SEM of combined data from at least three independent experiments. Significance was determined by two‐way ANOVA with Tukey's multiple comparison test. n.s., not significant; ****P ≤ 0.0001.
-
BFormaldehyde‐fixed RFP+ UPEC were mixed with 10 μM Alexa‐Fluor488‐hGBP1F or ‐hGBP1F R584‐586A supplemented with 2 mM GTP. Following 60 min of incubation, hGBP1F‐enclosed UPEC were quantified. Graphs depict mean ± SEM of combined data from three independent experiments. Significance was determined by unpaired t‐test, two‐tailed. ****P ≤ 0.0001.
-
CFormaldehyde‐fixed RFP+ UPEC were mixed with 10 μM Alexa‐Fluor488‐hGBP1F or ‐hGBP1F R584‐586A and 2 mM GTP. Samples were fixed after 60 min of incubation and stained with an antibody against the inner core/lipid A fragment of E. coli LPS (anti‐LPS). The frequency of anti‐LPS stained UPEC was quantified. Graphs show mean ± SEM of combined data from three independent experiments. Significance was determined by two‐way ANOVA with Tukey's multiple comparison test. n.s., not significant; ****P ≤ 0.0001.
-
DIFNγ‐primed wild type and hGBP1‐KO HeLa cells stably expressing inactive mutant YFP‐Caspase‐4C258S were infected with either cytosol‐entering Salmonella enterica Typhimurium mutant ΔsifA (MOI = 25) or with Shigella flexneri ΔospC3ΔipaH9.8 (MOI = 6), a mutant strain lacking Caspase‐4 antagonist OspC3 as well as hGBP1 antagonist IpaH9.8. Cells were fixed at 4 hpi (ST ΔsifA) or at 2 hpi (Sf ΔospC3ΔipaH9.8) and stained for endogenous hGBP1. YFP‐Caspase‐4C258S associated bacteria were quantified, and mean ± SEM of combined data from three independent experiments are shown. Significance was determined by two‐way ANOVA with Tukey's multiple comparison test. ****P ≤ 0.0001.
