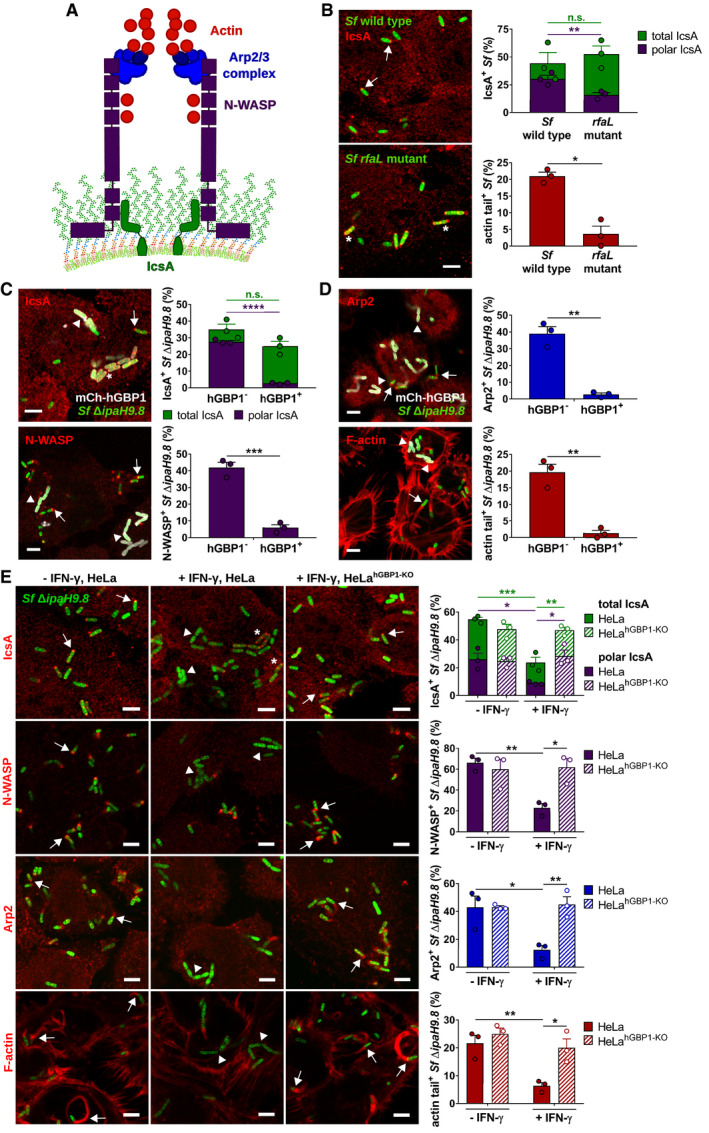
Figure 7. hGBP1 disrupts polar localization of Shigella IcsA and blocks the recruitment of the host actin polymerization machinery.

-
ASchematic depicts the molecular mechanism by which Shigella flexneri co‐opts the host actin polymerization machinery: The bacterial autotransporter IcsA localizes to one bacterial pole where it recruits and activates host actin nucleation‐promoting factor N‐WASP. N‐WASP then recruits and activates the host actin nucleator Arp2/3 complex to initiate actin polymerization.
-
B–ECells were infected with poly‐d‐lysine treated GFP+ Shigella flexneri strains at an MOI of 6. Cells were stained for indicated proteins, and Z‐stacks were recorded using confocal fluorescence microscopy. Actin tails were classified as tails when ≥ 2.5 μm. All graphs show mean values ± SEM of combined data from three independent experiments. All scale bars are 5 μm. Arrows point to bacteria associated with indicated proteins, arrowheads point to bacteria lacking indicated proteins, and asterisks mark bacteria lacking unipolar IcsA localization. (B) Unprimed HeLa cells were infected with wild type or rfaL S. flexneri. Total and unipolar localization of IcsA as well as the actin tail formation were quantified at 1 hpi. Significance was determined by unpaired two‐tailed t‐tests. n.s., not significant; *P ≤ 0.05; **P ≤ 0.01. (C, D) mCherry‐hGBP1 was expressed in HeLa hGBP1‐KO cells infected with S. flexneri ΔipaH9.8 and stained for IcsA, N‐WASP, Arp2, and F‐actin at 2.5 hpi. Colocalization of hGBP1 and indicated proteins on bacteria was quantified. Significance was determined by unpaired t‐tests, two‐tailed. n.s., not significant; **P ≤ 0.01; ***P ≤ 0.001; ****P ≤ 0.0001. (E) IFNγ‐primed and unprimed wild type and hGBP1‐KO HeLa cells were infected with S. flexneri ΔipaH9.8, and subcellular localization of IcsA, N‐WASP, Arp2, and F‐actin was assessed and quantified at 2.5 hpi. Significance was determined by two‐way ANOVA with Tukey's multiple comparison test. *P ≤ 0.05; **P ≤ 0.01; ***P ≤ 0.001.
Source data are available online for this figure.
