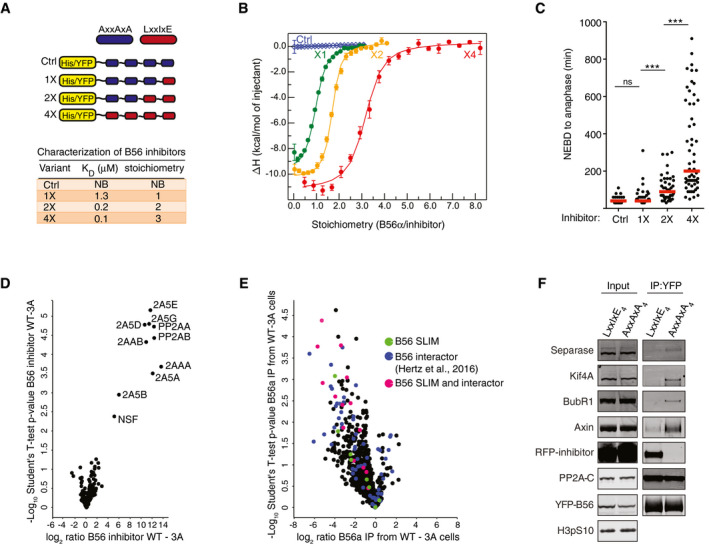
Figure 1. Development of a PP2A‐B56 specific inhibitor.

-
A, BSchematic of the B56 inhibitor series and affinities and stoichiometry's for B56α measured by ITC. Global direct fitting shown for one experiment (reverse). Each dot is the integrated heat per injection, and the error bars represent uncertainty with this integrated value. The experiment was done in both direct (B56 in cell) and reverse (B56 in syringe) with similar results.
-
CTime from nuclear envelope breakdown (NEBD) to mitotic exit of cells expressing the indicated B56 inhibitors with each circle representing a single cell. Only cells with similar expression levels of the various B56 inhibitor constructs were analyzed. Median time is indicated by red line. A representative result from at least three independent experiments is shown. At least 25 cells were counted per condition in the experiment shown. A Mann–Whitney U‐test was used for statistical analysis (ns: non‐significant, ***P ≤ 0.001).
-
DVolcano plot representing mass spectrometry identified proteins co‐purifying with B56 inhibitor versus control inhibitor from HeLa cells. PP2A‐B56 subunits co‐purifying with the B56 inhibitor are indicated.
-
E, FCompetition assay in HeLa cells stably expressing RFP‐tagged B56 inhibitor (LxxIxE) or control inhibitor (AxxAxA). YFP‐B56α was transfected into and subsequently purified from these cell lines. Loss of binding of indicated proteins determined by either mass spectrometry (pink—B56 SLiM‐containing protein and known B56 interactor; blue—known B56 interactor, green—B56 SLiM‐containing protein) (E) or Western blotting (F).
