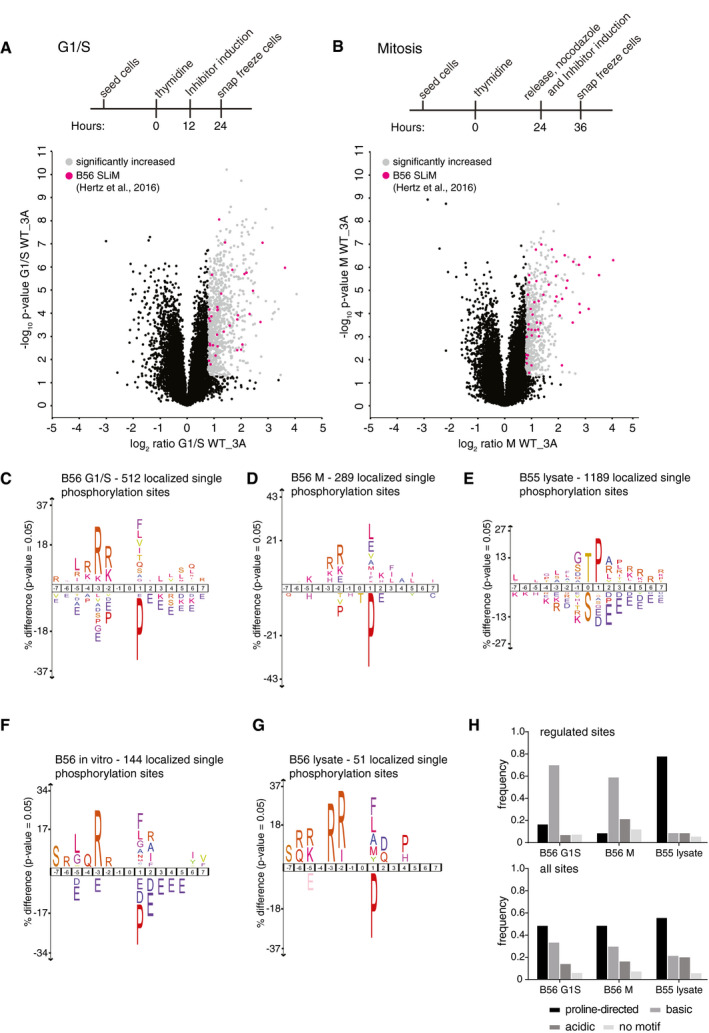
Figure 2. Phosphorylation site preference of PP2A‐B56.

-
A, BSchematic of synchronization protocol for G1/S (A) or mitotic (B) arrested cells and accompanying volcano plot of phosphorylation sites quantified. The phosphorylation sites showing an increase in the presence of the B56 inhibitor are shown in light gray. Phosphorylation sites in a protein containing an LxxIxE motif are colored pink.
-
C–EIceLogo representation of over‐ and underrepresented amino acid residues surrounding phosphorylation sites for the indicated experiments (letter coloring is standard iceLogo color output).
-
F, GIceLogo representation of over‐ and underrepresented amino acid residues surrounding phosphorylation sites for the experiments indicated in Fig EV2F and G, respectively (letter coloring is standard iceLogo color output).
-
HDistribution of phosphorylation site consensus motifs surrounding B56‐ or B55‐dependent up‐regulated phosphorylation sites (top panel) in comparison with all phosphorylation sites (bottom panel) in the indicated experiment (proline‐directed: pS/TP; basic: R/KxxpS/T, R/KxpS/T, R/KpS/T; acidic: D/E/NxpS/T, D/EpS/T, pS/TD/E, pS/TxD/E; x—any amino acid).
