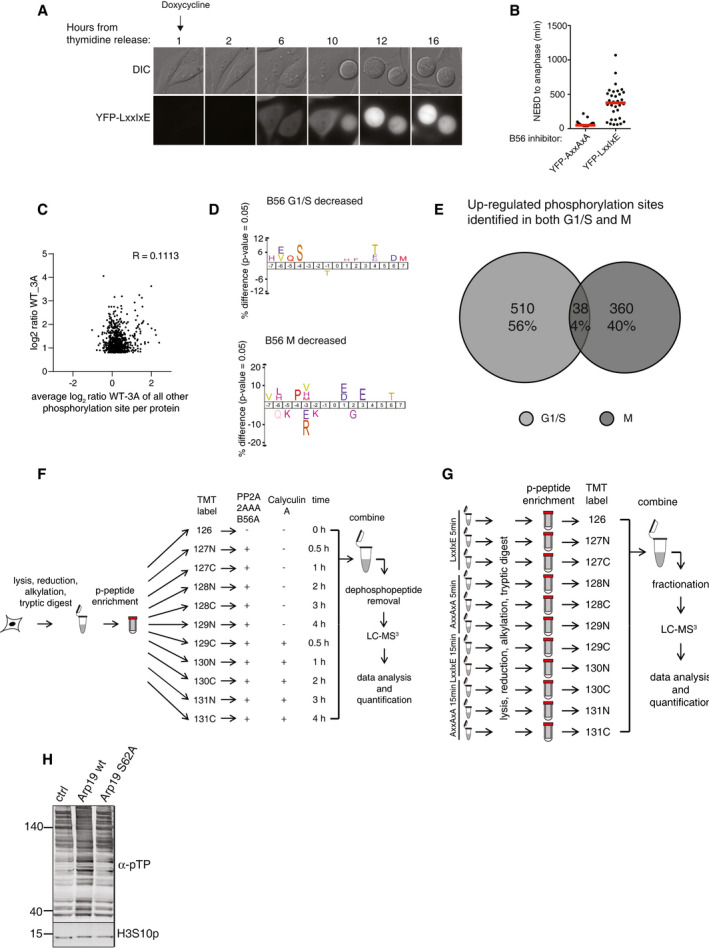
Figure EV2. Phosphoproteomics on cells expressing the B56 inhibitor.

- Live‐cell imaging of cells expressing doxycycline‐inducible B56 inhibitor. Cell were released from a thymidine block and followed into mitosis. Doxycycline was added at time 0 h.
- Quantification of mitotic duration of cells from (A) Each circle represents a single cell and median time in mitosis indicated by red line. A representative result from at least three independent experiments is shown. At least 20 cells were counted per condition in the experiment shown. NEBD; nuclear envelope breakdown.
- Comparison of log2 ratios of B56‐dependent dephosphorylation sites versus other phosphorylation sites on the same protein.
- IceLogo representation of over‐ and underrepresented amino acid residues surrounding phosphorylation sites for the down‐regulated phosphorylation sites from experiments presented in Fig 2A and B.
- Venn diagram showing overlap of PP2A‐B56‐regulated sites in G1/S and mitosis (M).
- Schematic of in vitro peptide phosphorylation assay set‐up corresponding to IceLogo of PP2A‐B56‐regulated sites in Fig 2F.
- Schematic of LxxIxE inhibition experiment in mitotic lysate corresponding to IceLogo of PP2A‐B56‐regulated sites in Fig 2G.
- Mitotic cell lysates treated with thiophosphorylated wt or S62A GST‐Arrp19 for 5 min followed by Western blotting with the antibodies indicated.
Source data are available online for this figure.
