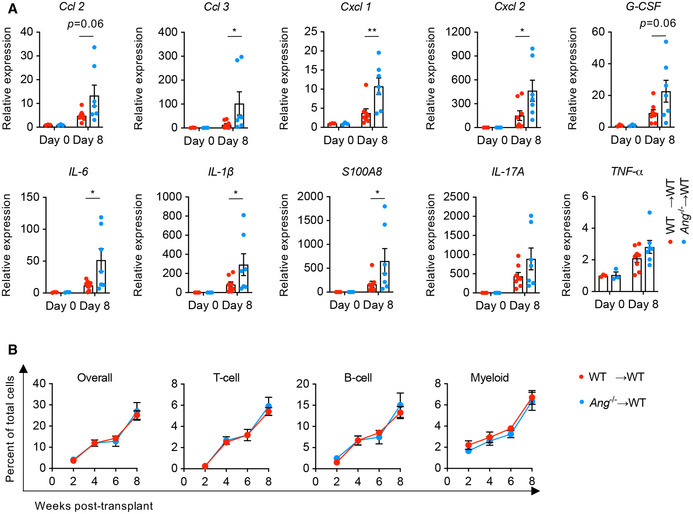
Figure EV1. Colonic cytokine production and multilineage reconstitution in chimera mice.

-
AQuantitative mRNA expression of cytokine genes in colonic tissue from WT→WT and Ang −/−→WT chimera mice on day 0 (n = 3) or day 8 (n = 7‐8) during DSS treatment.
-
BMultilineage reconstitution analysis in chimera mice (n = 5).
