-
A, B
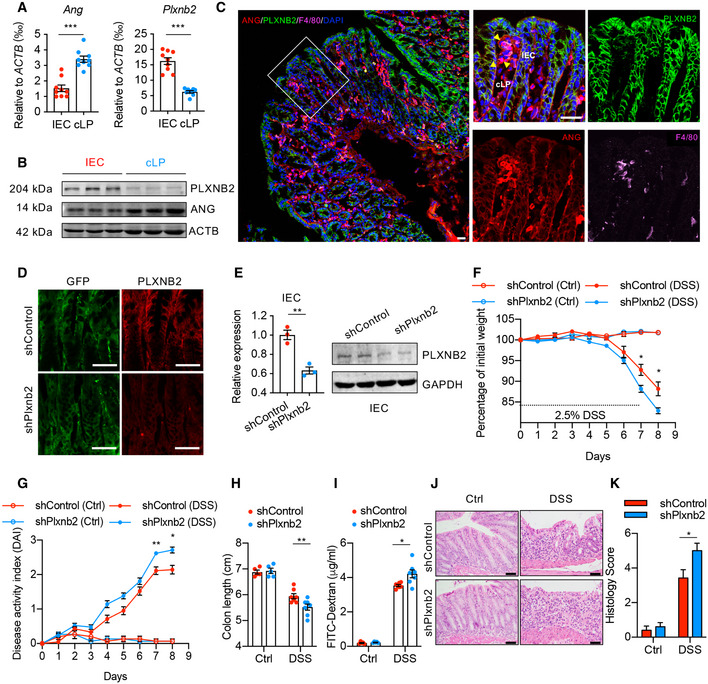
(A) Quantitative mRNA expression and (B) Western blotting of ANG and PLXNB2 in isolated IECs or colonic laminar propria (cLP) cells from WT mice (n = 9).
-
C
Representative images showing immunofluorescence staining of ANG, PLXNB2, and macrophage surface marker F4/80 in frozen colonic section from WT mice.
-
D
Representative images showing immunofluorescence staining of GFP and PLXNB2 in frozen colonic section from WT mice infected with adeno‐associated virus (AAV9).
-
E
PLXNB2 expression in IECs from the AAV9‐infected WT mice (n = 3).
-
F, G
(F) Body weight loss and (G) DAI of the AA9‐infected WT mice with (n = 7) or without (n = 5) 2.5% DSS treatment.
-
H–K
(H) Colon length, (I) serum FITC‐dextran level, (J) representative HE staining image, and (K) histopathological score of colonic section from the AAV9‐infected WT mice on day 8 with (n = 7) or without (n = 5) 2.5% DSS treatment.
Scale bar, 50 μm; data are shown as the mean ± SEM, Mann–Whitney test (A, G, and I), and two‐tailed unpaired Student's
t‐test (E, F, H, and K) are used to determine statistical significance (*
P < 0.05, **
P < 0.01; ***
P < 0.001).
Source data are available online for this figure.

