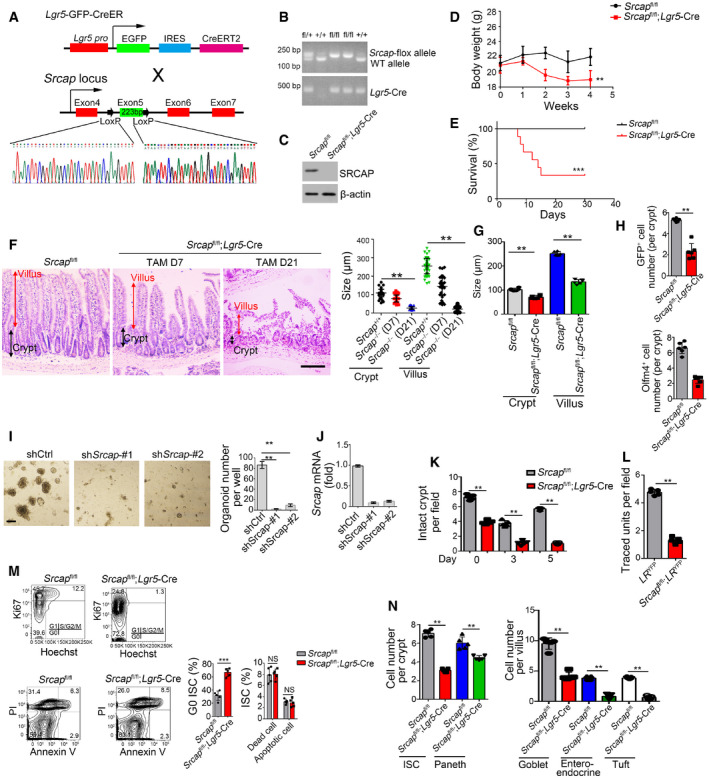
Figure EV2. Generation strategies of Srcap flox mice.

- Schematic diagram of Srcap flox construction by CRISPR/Cas9 technology.
- Srcap‐deficient pups were genotyped after crossing.
- SRCAP protein was examined in Srcap‐deleted ISCs by immunoblotting.
- Body weight changes of Srcap fl/fl and Srcap fl/fl; Lgr5 GFP‐CreERT2 mice after TAM treatment were shown as means ± SD. n = 10. **P < 0.01 by two‐tailed Student's t‐test.
- Kaplan–Meier survival curves of Srcap fl/fl and Srcap fl/fl; Lgr5 GFP‐CreERT2 mice after TAM treatment. n = 10. ***P < 0.001 by log‐rank test.
- Representative images of duodenum from 8‐week‐old Srcap fl/fl and Srcap fl/fl; Lgr5 GFP‐CreERT2 mice after TAM treatment for indicated time (n = 5 per group). Scale bar, 100 μm. Length of 100 villi and 100 crypts was measured and shown in right panel as means ± SD. **P < 0.01 by two‐tailed Student's t‐test.
- Biological variations and statistical tests were shown as in Fig 2A. Length of villi and crypts (means per mouse) was measured and shown as means ± SD n = 6. **P < 0.01 by two‐tailed Student's t‐test.
- Biological variations and statistical tests were shown as in Fig 2B. ISC numbers per crypt (means per mouse) were shown as means ± SD n = 6. **P < 0.01 by two‐tailed Student's t‐test.
- 1 × 10⁴ ISCs were collected and infected with shSrcap lentivirus followed by organoid formation. Typical images of organoid formation were shown in left panel. Scale bar, 200 μm. Organoid numbers per well were counted as means ± SD in right panel. **P < 0.01 by two‐tailed Student's t‐test. n = 6 for each group.
- Srcap was examined in Srcap‐depleted cells by real‐time PCR. Primers were listed in Table EV1. Relative gene expression folds were normalized to endogenous β‐actin and shown as means ± SD.
- Biological variations and statistical tests were shown as in Fig 2D. Numbers of intact crypts (means per mouse) were shown as means ± SD n = 5. **P < 0.01 by two‐tailed Student's t‐test.
- Biological variations and statistical tests were shown as in Fig 2E. Numbers of traced crypt‐villus units (means per mouse) were shown as means ± SD n = 5. **P < 0.01 by two‐tailed Student's t‐test.
- Cell cycle and apoptosis of Srcap +/+ and Srcap –/– ISCs were examined by Hoechst/Ki67 and PI/Annexin V FACS and shown in left panel. n = 6 mice per group. Percentages of G0 stage ISCs and apoptotic ISCs were counted as means ± SD (right panel). **P < 0.01 by two‐tailed Student's t‐test.
- Biological variations and statistical tests showed means per mouse as in Fig 2G. Numbers of each kind of epithelial cells from crypts or villi (means per mouse) were shown in right panel as means ± SD n = 5. **P < 0.01 by two‐tailed Student's t‐test.
Source data are available online for this figure.
