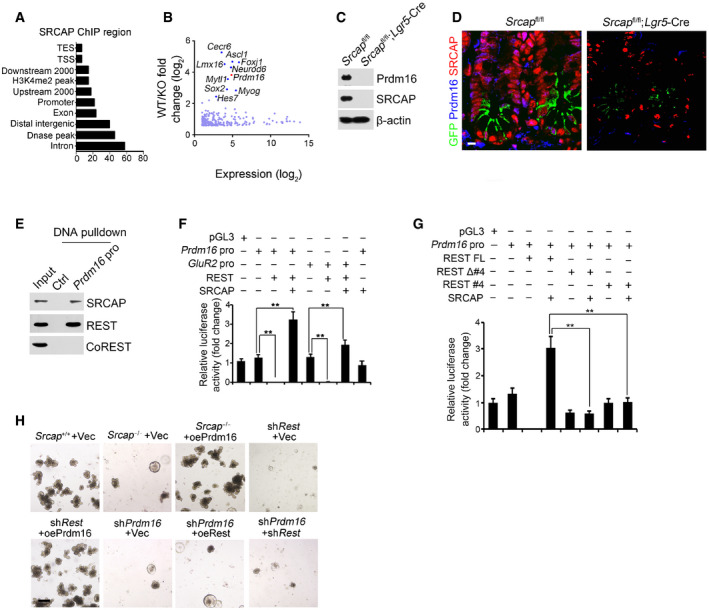
Figure 4. REST recruits SRCAP onto Prdm16 promoter for its transcription.

-
AAnalysis for genome‐wide SRCAP binding regions in ISCs from ChIP‐seq was shown. Coordinate information for sequence alignment was from UCSC (intron and exon), Ensemble GRCM38 (mm10, release‐90) (upstream 2,000 bp, downstream 2,000 bp, distal intergenic region, TSS (transcription start site), TES, and promoter), GSE57919 (Dnase‐seq peaks, liftover to mm10), and GSE34568 (H3K4me2, liftover to mm10). Distribution of SRCAP peaks in ChIP‐seq and its overlap with each kind of region was analyzed by bedtools.
-
BTranscriptome microarray analysis between Srcap −/− ISCs and WT ISCs. Top ten downregulated TFs in Srcap −/− ISCs were listed.
-
CPrdm16 expression was tested in Srcap +/+ and Srcap −/− ISCs by Western blotting.
-
DPrdm16 expression was visualized in indicated intestinal tissues by immunofluorescence staining. Green: GFP; red: SRCAP; blue: Prdm16. Scale bar, 10 μm.
-
EPrdm16 promoter (−875˜−854) region was used as probe to perform DNA‐pulldown assay with murine intestinal crypt lysates followed by immunoblotting.
-
F, GIndicated promoter activation was analyzed with luciferase assay. DKK1 was used as a control. Results of relative fold changes are shown as means ± SD. Data represent five independent replicates. **P < 0.01 by two‐tailed Student's t‐test.
-
H1 × 104 ISCs from indicated mice were collected for organoid formation. For gene depletion or restoration, ISCs were infected with lentivirus. Scale bar, 200 μm.
