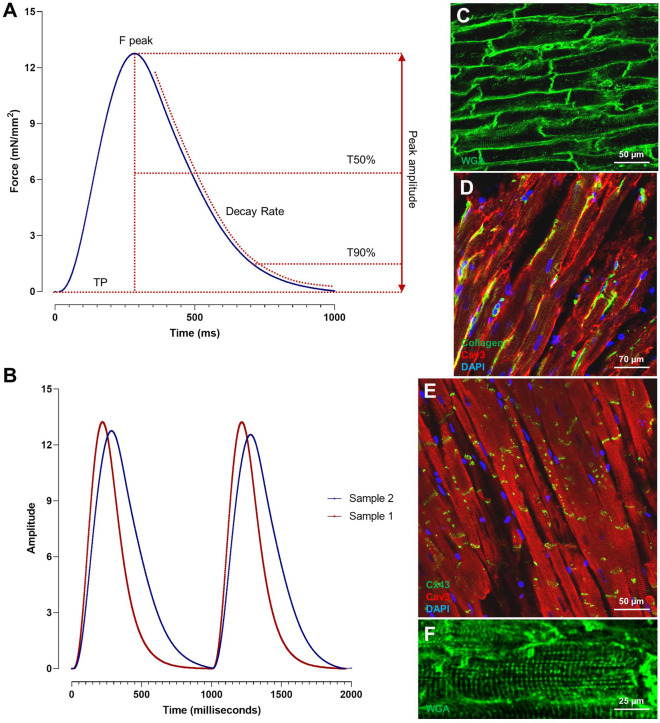
Figure 2.
Contractility recordings and representative confocal images of living myocardial slice. (A) Schematic illustration of contractility parameters (TP = Time to Peak, T50% = Time to 50% relaxation, T90% = Time to 90% relaxation, Decay Rate). (B) Representative traces of the contractile capacity of two myocardial slices displaying a faster (red) and slower (blue) contraction and relaxation kinetics. (C–F) Wheat germ agglutinin (WGA) staining allows the visualization of cell membrane and it is used to study cardiomyocytes dimensions and T-tubule organization. Immunohistochemical staining for Collagen, Connexin43, and Caveolin 3 were used to visualize collagen organization, gap junction distribution, and cardiomyocytes morphology.3,5

