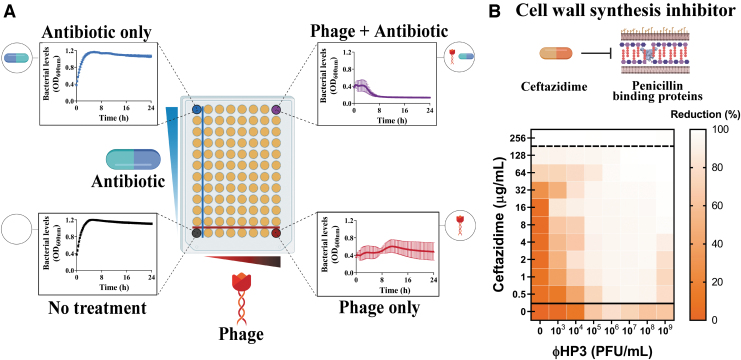
FIG. 3.
Phage-antibiotic combinatorial testing via synography. (A) Diagram of the plate layout showing on the Y-plane increasing concentrations of antibiotics and on the X-plane increasing concentrations of phage. (B) A typical synogram here showing Escherichia coli phage (ΦHP3) and ceftazidime. Killing activity is represented as a heat map with the greatest percent reduction of bacterial density of viability represented by lighter regions and the least percent reduction in bacteria represented by increasing color (in this case, orange). In synography, the heat-map is indicative of optimal concentrations of phages and antibiotics that are most effective. Such data can guide clinicians in making scientifically driven and informed decisions about the optimal phages and antibiotics to use during treatment.

