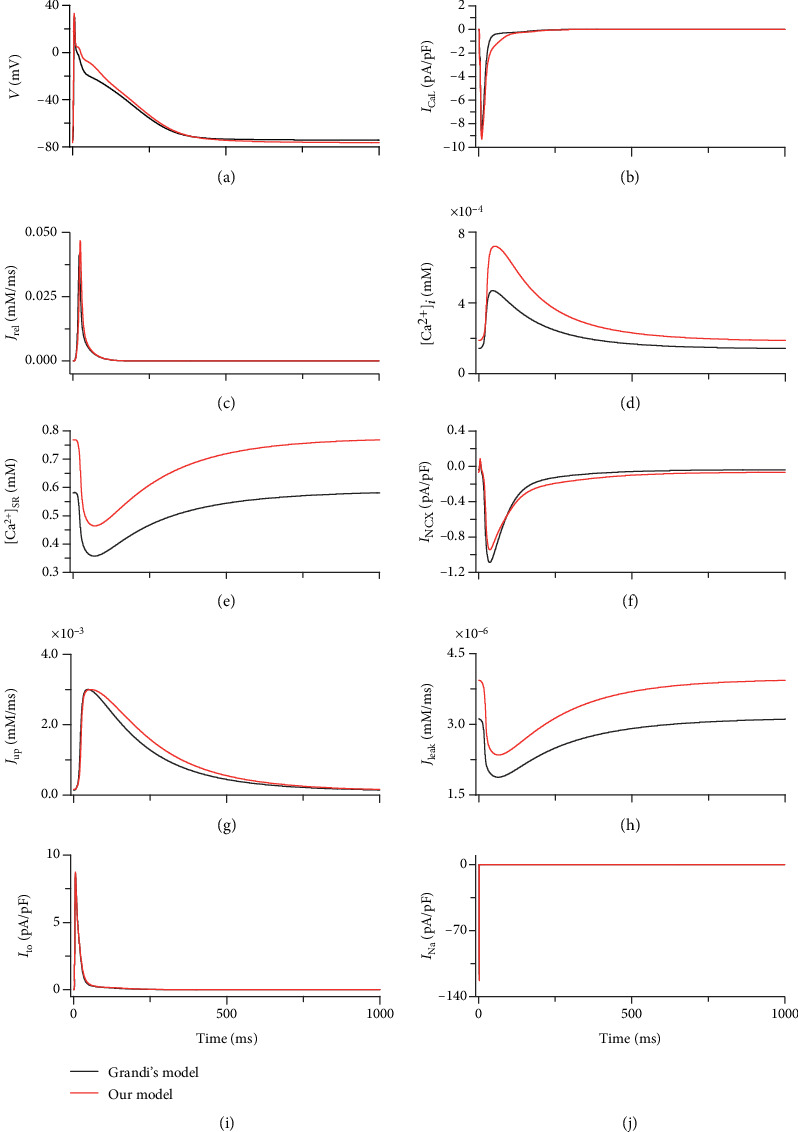
Figure 3.

Traces of AP, ionic currents, and calcium cycling produced by our model (red) and the model of Grandi et al. [33] (black). (a) AP. (b) ICaL. (c) SR Ca2+ release (Jrel). (d) intracellular Ca2+ concentration ([Ca2+]i). (e) SR Ca2+ concentration ([Ca2+]SR). (f) INCX. (g) SR Ca2+ reuptake (Jup). (h) SR Ca2+ leakage (Jleak). (i) Ito. (j) INa.
