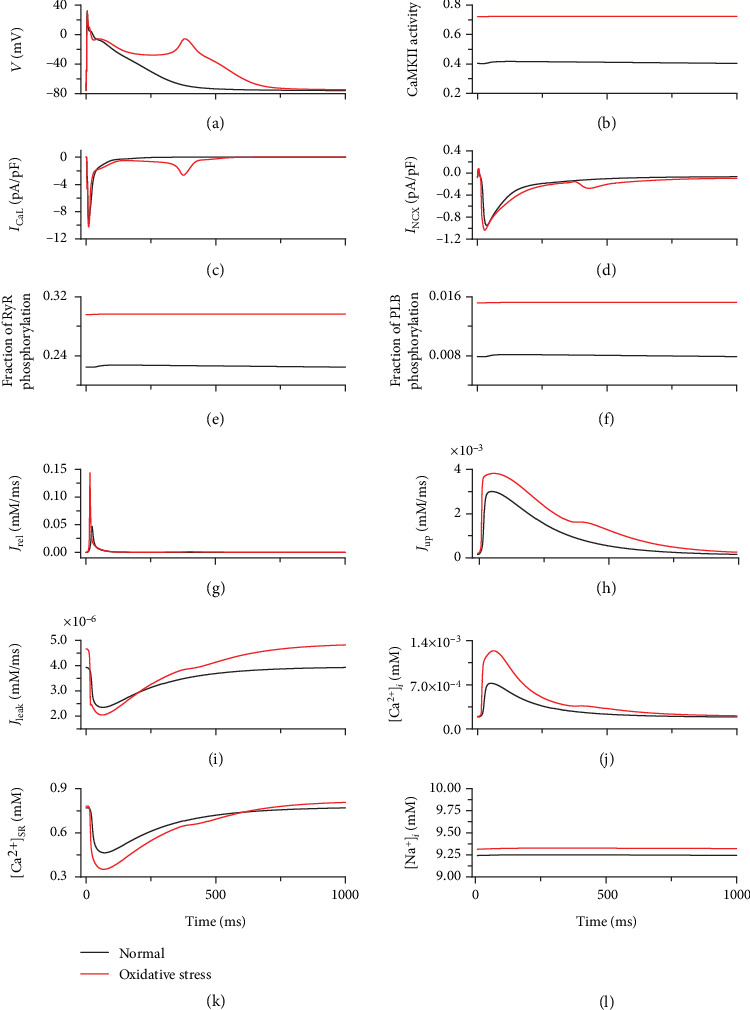
Figure 5.

Traces of AP, ionic currents, and calcium cycling under normal (black) and oxidative stress (red) conditions. (a) AP. (b) CaMKII activity. (c) ICaL. (d) INCX. (e) Fraction of RyR phosphorylation. (f) Fraction of PLB phosphorylation. (g) Jrel. (h) Jup. (i) Jleak. (j) [Ca2+]i. (k) [Ca2+]SR. (l) Intracellular Na+ concentration ([Na+]i).
