
Figure 4.
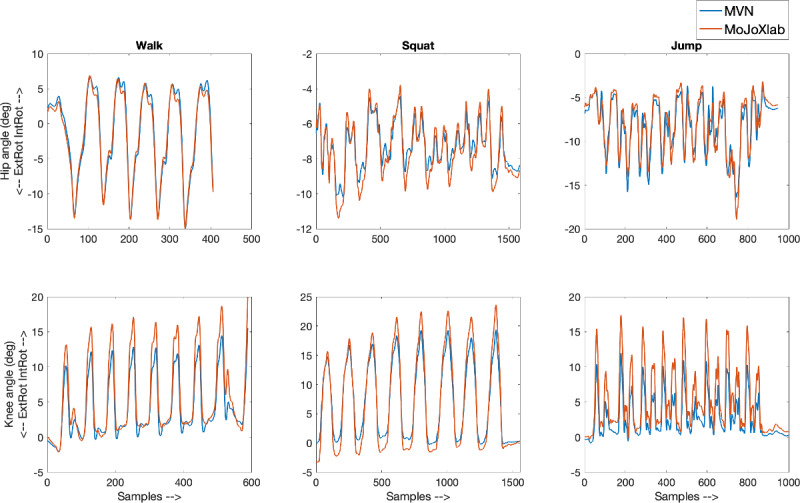
Representative transverse plane joint angle waveforms from the healthy participant data set. Waveforms for the hip (top row) and knee (bottom row) joint angles obtained from MVN Analyze (blue) and our custom software MoJoXlab (orange) for walking (left), squatting (center), and jumping (right) tasks. The y-axis represents joint angles in degrees, and the x-axis represents data samples across the entire waveform.