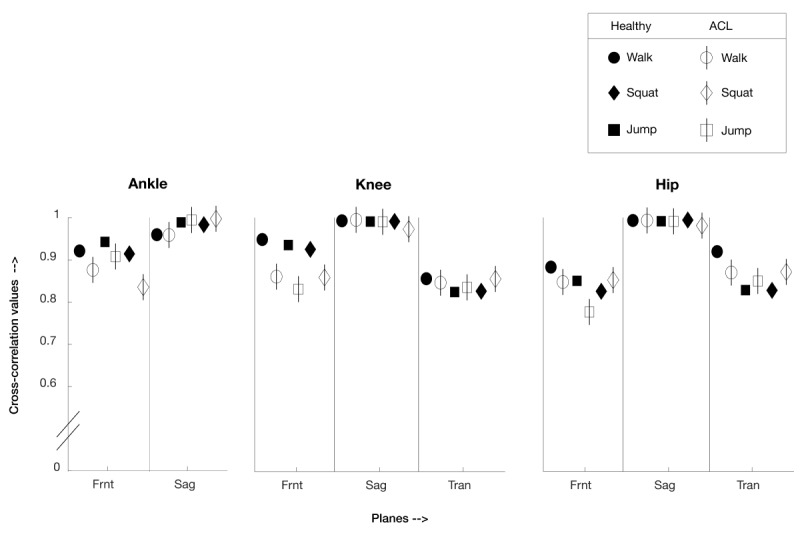
Figure 8.

Mean cross-correlation values between MVN Analyze and MoJoXlab for healthy participants (black) and anterior cruciate ligament reconstruction participants (white), presented in a graphical format for visualization and overall comparison purposes. Values close to 1 indicate a very high correlation (circle—values for the walk task, square—values for jump task, and diamond—values for squat task; planes: Frnt—frontal, Sag—sagittal, and Tran—transverse).
