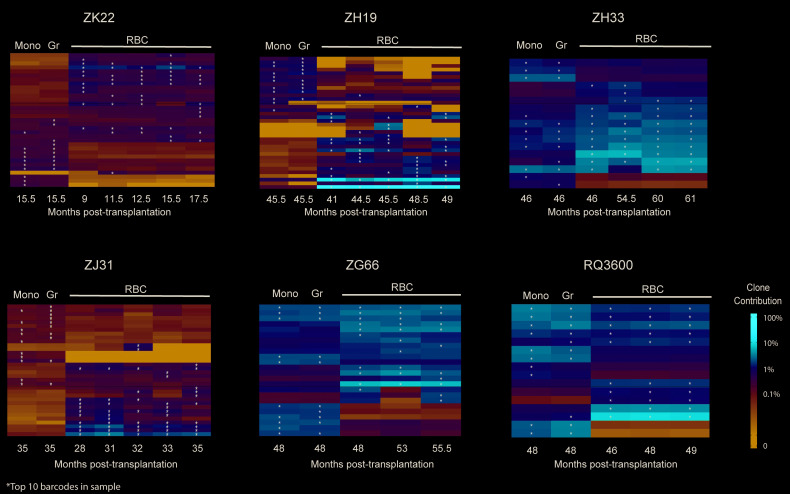
Figure 5.
Stability of erythroid clonal contributions over time. Heatmaps plotting barcode contributions to peripheral blood (PB) red blood cell (RBC) RNA over time in five young macaques and one aged (RQ3600) macaque, compared to DNA barcode from PB monocytes (Mono) and granulocytes (Gr). Each heatmap plots the top ten contributing clones in each sample across all samples, heatmaps were made as explained in Figure 2B. The color scale is on the right.

