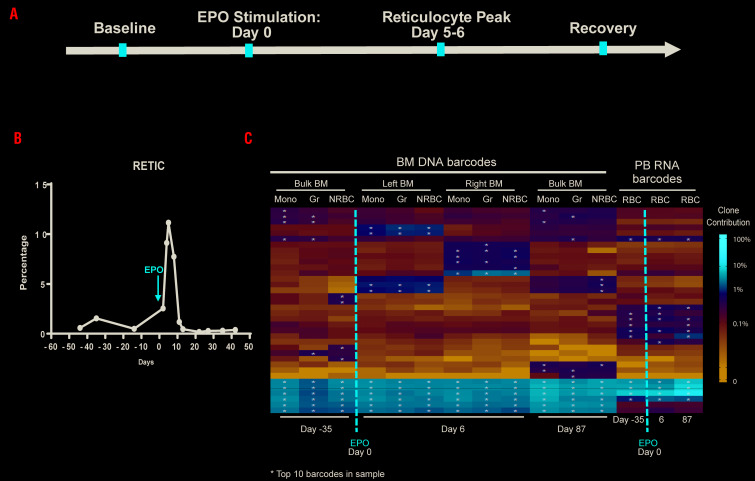
Figure 6.
Impact of erythropoietin (EPO) administration on erythroid clonal patterns. (A) Timeline of EPO stimulation and sampling in ZL40, EPO was administrated at 11.5m post transplantation. (B) The reticulocyte (RETIC) percentage during EPO stimulation. (C) Heatmap of the top ten contributing clones from bone marrow (BM) monocytes (Mono), granulocytes (Gr) and nucleated red blood cell (NRBC) DNA barcodes and peripheral blood (PB) red blood cell (RBC) RNA barcodes samples before and post EPO stimulation. Heatmap was constructed as described in Figure 2B. day -35: baseline, day 6: reticulocyte peak, and day 87: recovery after EPO stimulation are shown.

