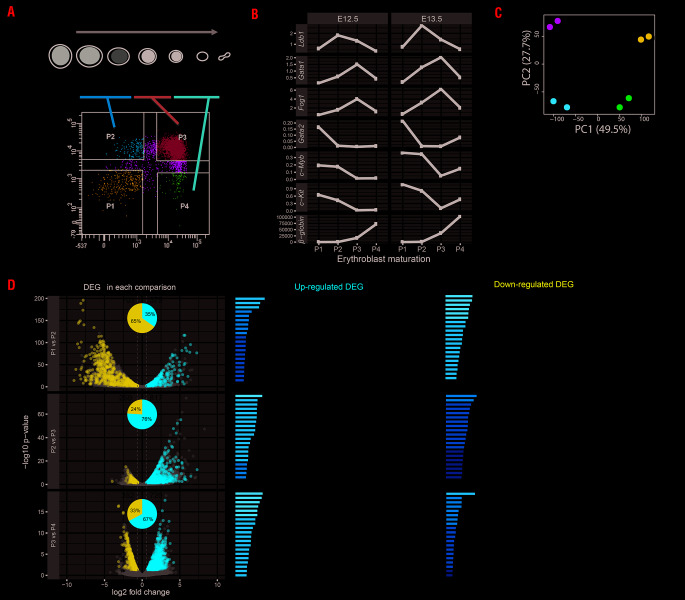
Figure 3.
Fetal liver cell sorting and RNA-sequencing data analysis. (A) Schematic description of erythroblast development. Fetal liver (FL) cells are sorted into four populations based on membrane markers TER119 and CD71. Different stages of erythroblasts are indicated into P2 to P4 populations. The C-KIT positive cell population (P1, CD71−/TER119−) represents precursors or other lineage cell types present before the initiation of erythroblast maturation. Proerythroblasts/colony forming uniterythroid [CFU-E] cells) express high level of CD71 and low level of TER119 (P2, CD71+/TER119−). Following erythroblast maturation, TER119 expression increases (P3, CD71+/TER119+). When the differentiation reaches the orthochromatic stage, they loose CD71 expression (P4, CD71−/TER119+). Pro: immature proerythroblast; Baso: basophilic erythroblast; Poly: polychromatic erythroblast; Orth: orthochromatic erythroblast; Ret: reticulocytes; Ery: erythrocyte. Gray bars represent the changes of c-Kit, Cd71 and Ter119 gene expression. The darker color of the bar represents higher expression for the indicated gene. (B) Quantitative PCR on indicated genes in E12.5 or E13.5 sorted FL cells (E12.5 and E13.5 were used as duplicates) as described in Panel A. Relative expression values are calculated by comparing to control gene Rnh1. (C) Principle component analysis of RNA-sequencing data from two replicates of each P1 to P4 sorted FL cells as described in (A) (D) The total number of down-regulated or up-regulated differentially expressed genes (DEG) are shown for each comparison in a Volcanoplot, in which x-axis represents log two-fold change and y-axis represents log 10 adjusted P-value. Significant DEG are shown in blue for down-regulated and red for up-regulated. Gray dots represent the non-significant genes. The ratio of down- or up-regulated DEG in each comparison is shown in pie-chart inserted in the Volcanoplot. Top 20 gene ontology terms for down- or up-regulated DEG in each comparison are shown.

