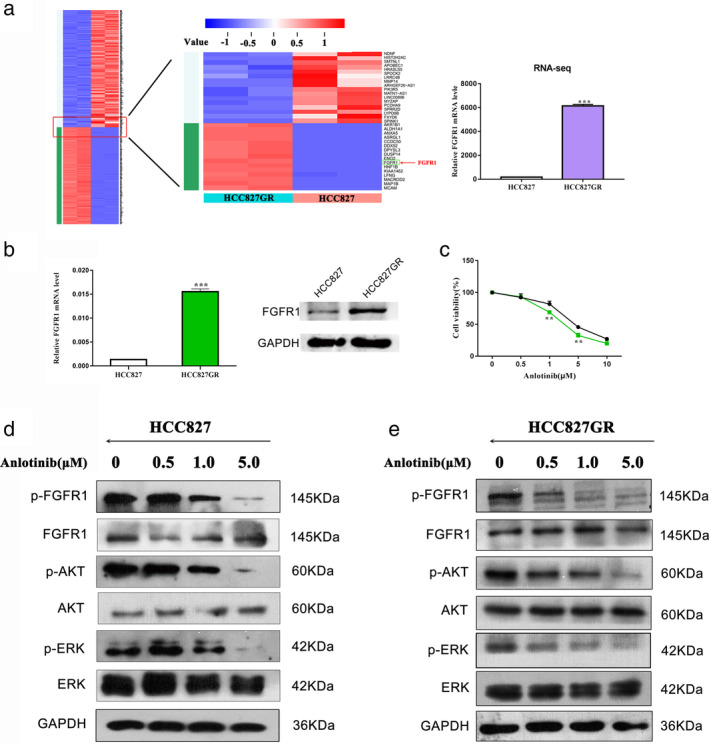
Figure 2.

FGFR1 expression is higher in HCC827 GR cells than in parental HCC827 cells. (a) RNA sequencing analysis was used to analyze differences in mRNA expression levels between HCC827 and HCC827 GR cells. (b) The expression level of FGFR1 was determined by quantitative real‐time PCR and Western blot analysis. (c) CCK‐8 assays were performed to investigate the effects of anlotinib on HCC827 and HCC827 GR cells in vitro ( HCC827 and
  HCC827 GR). (d) and (e) Western blot analysis was used to detect the effect of anlotinib on p‐FGFR1, p‐AKT and p‐ERK in HCC827 and HCC827 GR cells. (** P < 0.01).
