Figure 4.

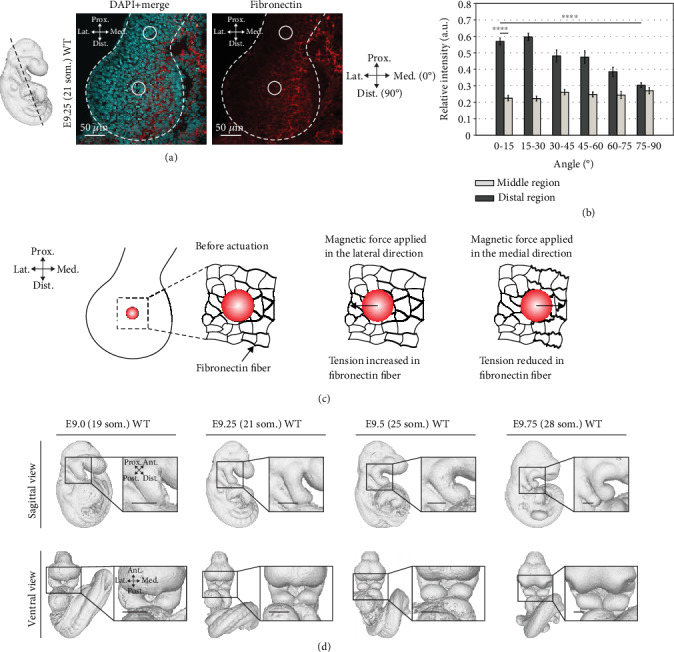
Fibronectin expression domain and fiber orientation match stiffness heterogeneity and anisotropy. (a) Transverse section of E9.25 (21 som.) WT embryos at mandibular region. Sections were stained with DAPI (cyan) and antifibronectin antibody (red). The black dashed line indicates the cryosection location. The white dashed lines outline the mandibular arch. The solid circles indicate the approximate location of the magnetic beads when performing stiffness measurement. (b) The angular distribution of fibronectin immunostaining fluorescence intensity (E9.25 (21 som.); n = 3 embryos) relative to the arch medial-lateral axis that was designated as 0 degree. Fluorescence intensity was quantified in the middle and distal regions using SIESTA (two-tailed t-test, ∗∗∗∗P < 0.0001). (c) Proposed mechanism of tension alteration by magnetic bead actuation, causing a lower stiffness value measured in the medial direction in the distal region. (d) WT mouse mandibular arch shape changes from E9.0 (19 som.) to E9.75 (28 som.) reconstructed from optical projection tomography. Error bars indicate s.e.m. Scale bars represent 200 μm (d).
