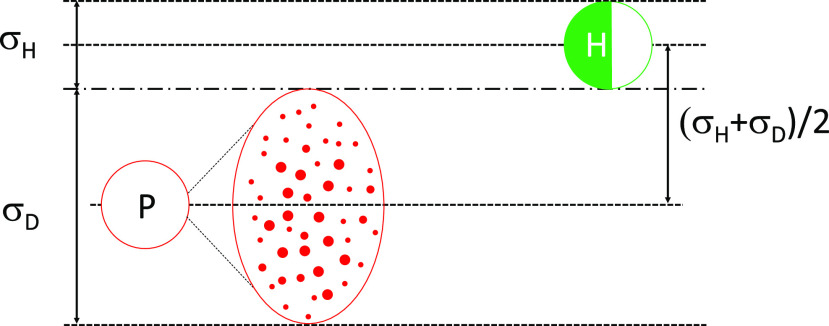
FIG. 2.
A schematic of the collision rate model for the infection to occur. Infected person P ejects a cloud of infectious droplets D denoted by small red dots, and the cloud approaches a healthy person H with a relative velocity to infect them. The figure also shows the collision volume swept by the droplet cloud D and H with their respective effective diameters.

