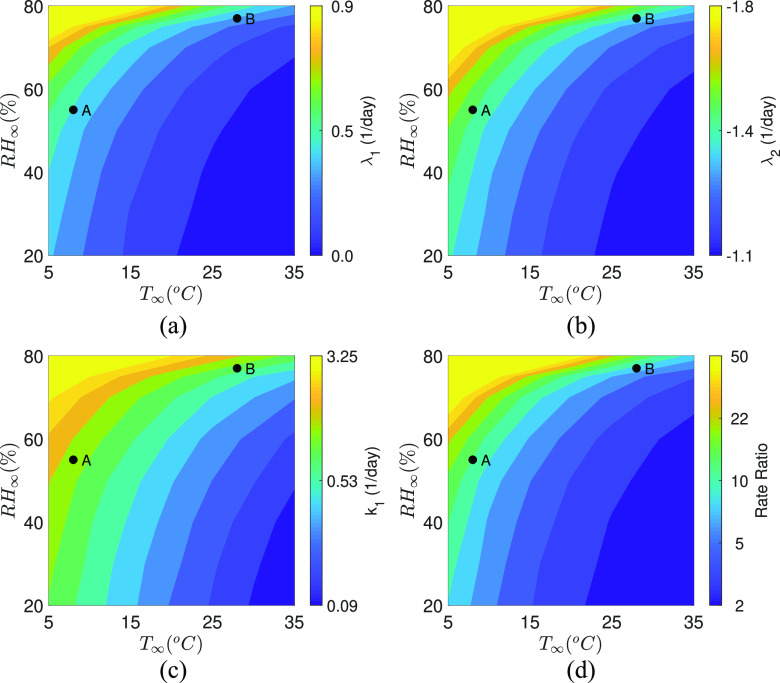
FIG. 6.
Contours of calculated eigenvalues (a) λ1 and (b) λ2 as a function of T∞ and RH∞. (c) Infection rate constant, k1, and (d) rate ratio over seven days as a function of T∞ and RH∞. Case A represents (T∞, RH∞) = (8, 55), while case B represents (T∞, RH∞) = (28, 77). The rate ratio for A and B are 16.60 and 10.33, respectively. Color bars have been clipped at reasonable values to show the respective variations over the wider region of interest.

