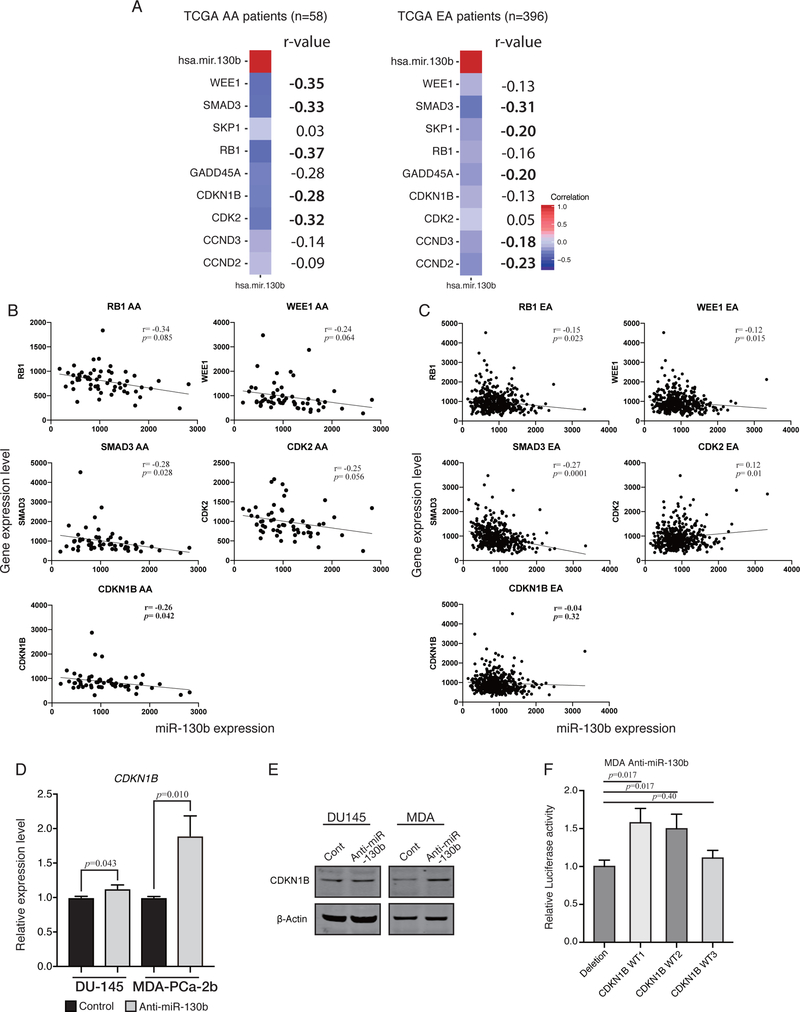
Figure 3. Pearson’s r correlation analysis showing that miR-130b expression affects cell cycle related genes in TCGA PRAD dataset (AA, n=59; EA, n=396).
(A) Heatmap of Pearson’s r correlation for the five most negatively correlated genes in AA (RB1, WEE1, SMAD3, CDKN1B and GADD45A) and EA (SMAD3, CCND2, SKP1, GADD45A and CCND3). Pearson’s r correlation was computed using all possible pairs of patient’s gene expression level for each gene. The number on the right of each heatmap indicates r-value (five topmost gene are shown in bold). (B) Representative dot plot analysis of five most negatively correlated genes in AA. Pearson’s r correlation was computed using all individual patient’s gene expression level for each gene. Five plots show the results from TCGA AA patients and (C) the other five plots show TCGA EA patients. (D) qPCR analysis for CDKN1B expression level in anti-miR-130b stable EA derived DU-145 cells and AA cells, MDA-PCa-2b. (paired t-test; n=3) (E) Western blotting for CDKN1B in anti-miR-130b stable EA derived cell DU-145 and AA cell, MDA-PCa-2b. (F) Luciferase reporter assay with three different vectors harboring miR-130b binding site. Each CDKN1B WT1/ WT2/ WT3 was from a different miRNA target database, miRWalk, IntaRNA and RNAhybrid, respectively (paired t-test; n=3).

