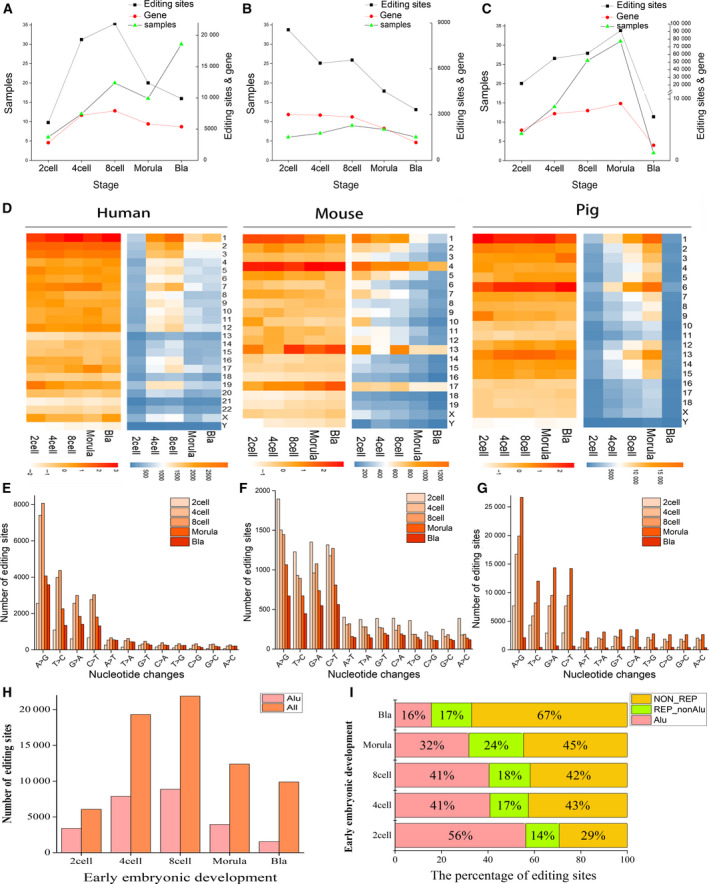
Fig. 1.

Distributions of RNA editing in different species, stages and chromosomes. (A–C) The relationships between the number of samples, the number of editing sites and the number of edited genes in different cells. The x axis is the phase of early embryonic development, and the y axis is the number of samples (left), the number of editing sites and the number of edited genes after deduplication (right). (D) The distribution of editing site numbers among different chromosomes. (E–G) Bar graphs represent nucleotide changes found by the REDItools. The x axis is 12‐nucleotide changes, and the y axis is the number of edits. From left to right are human, mouse and pig. (H) Distribution of the Alu region and the number of editing sites during early embryonic development. Red represents the number of editing sites occurring in the Alu region, and orange represents the number of all RNA editing sites. (I) The percentage of editing sites in the repeat sequence for human. The x axis is the percentage of editing sites in the Alu, and the y axis is the different developmental stages. Red is the proportion of the editing sites occurring in the Alu region, green is the repeating region except Alu, and yellow is the non‐repeating region.
