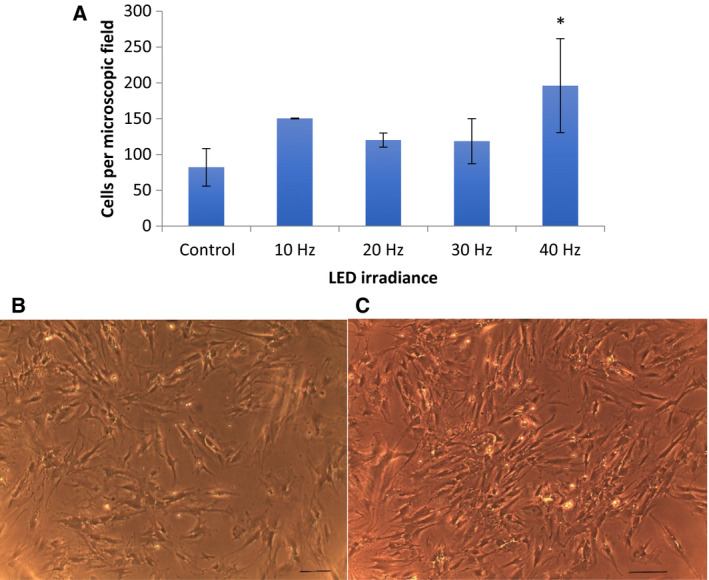
Fig. 3.

Cell number per microscopic field. (A) Mean values with standard deviation (vertical bars) are presented. Significantly higher number of cells in cultures observed (images B, C) following pulsed white LED irradiance at 40 Hz frequency (*P < 0.01, n = 6). (B) Representative microscopic image of a control culture (scale 20 µm). (C) Representative microscopic image of a cell culture following exposure to 40 Hz LED irradiance protocol (scale 20 µm).
