
Fig. 4.
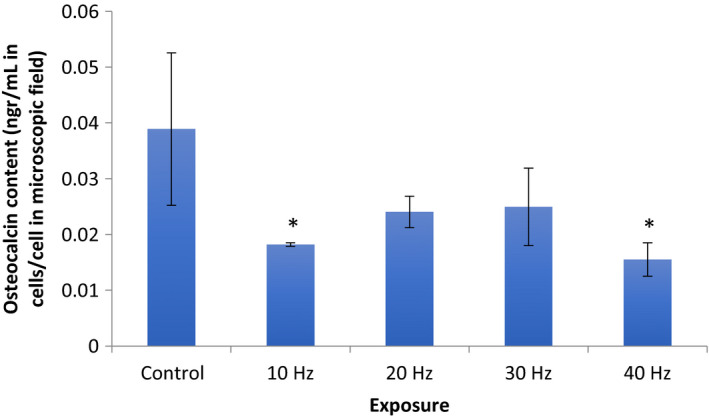
Cellular osteocalcin content in cells following different frequency regimes of irradiance. There is a significant decrease following the 10 Hz and 40 Hz irradiance in comparison with other experimental conditions and controls (*P < 0.05, n = 6). Mean values with standard deviation (vertical bars) are presented.