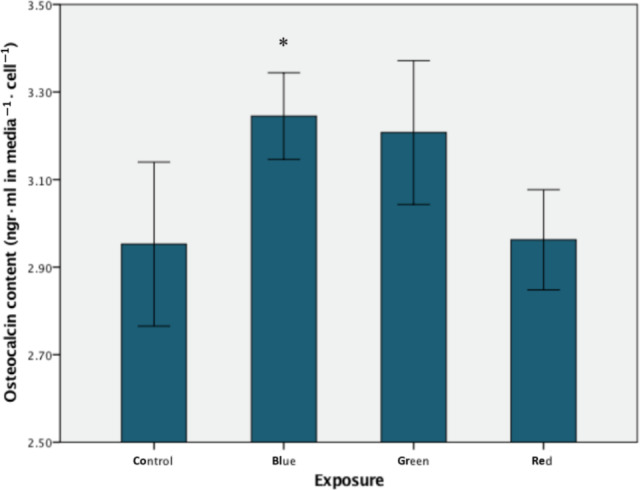
Fig. 7.

Cellular osteocalcin content. There is a significant increase following the blue range light irradiance of cells in comparison with the controls (*P < 0.05, n = 6). Mean values with standard deviation (vertical bars) are presented. Filtered light predominant irradiance: red—593–840 nm, green—560–650 nm, blue—420–580 nm.
