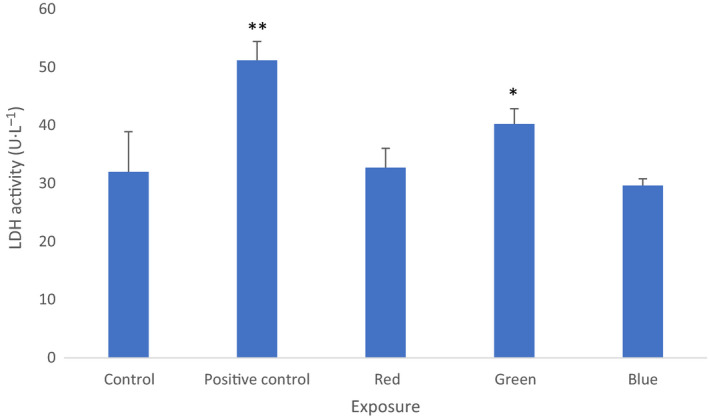
Fig. 8.

LDH activity in culture media. There is a significant increase following the green range light irradiance of cells in comparison with the controls (*P < 0.05, **P < 0.001, n = 6). Mean values with standard deviation (vertical bars) are presented. Filtered light predominant irradiance: red—593–840 nm, green—560–650 nm, blue—420–580 nm, control—cells kept in dark, positive control—cells kept in dark and treated by FGIN‐1‐2710‐5 m.
