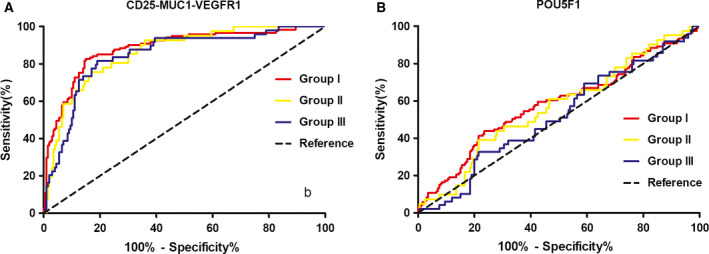
Fig. 1.

Receiver operating characteristic curve analysis of circulating IgG levels in three subgroups of NSCLC. Group I for stages 1 and 2A, group II for stage 2B, and group III for stages 3 and 4. (A) The CD25‐MUC1‐VEGFR1 IgG assay with a specificity of 95% showed an AUC of 0.883 (95% CI 0.844–0.923) with a sensitivity of 49.6% in group I, an AUC of 0.861 (95% CI 0.804–0.918) with a sensitivity of 39.0% in group II, and an AUC of 0.846 (95% CI 0.785–0.907) with a sensitivity of 26.5% in group III. (B) The POU5F1 IgG assay with a specificity of 95% showed an AUC of 0.582 (95% CI 0.516–0.648) with a sensitivity of 10.7% in group I, an AUC of 0.566 (95% CI 0.470–0.663) with a sensitivity of 7.3% in group II, and an AUC of 0.518 (95% CI 0.429–0.607) with a sensitivity of 2.0% in group III.
