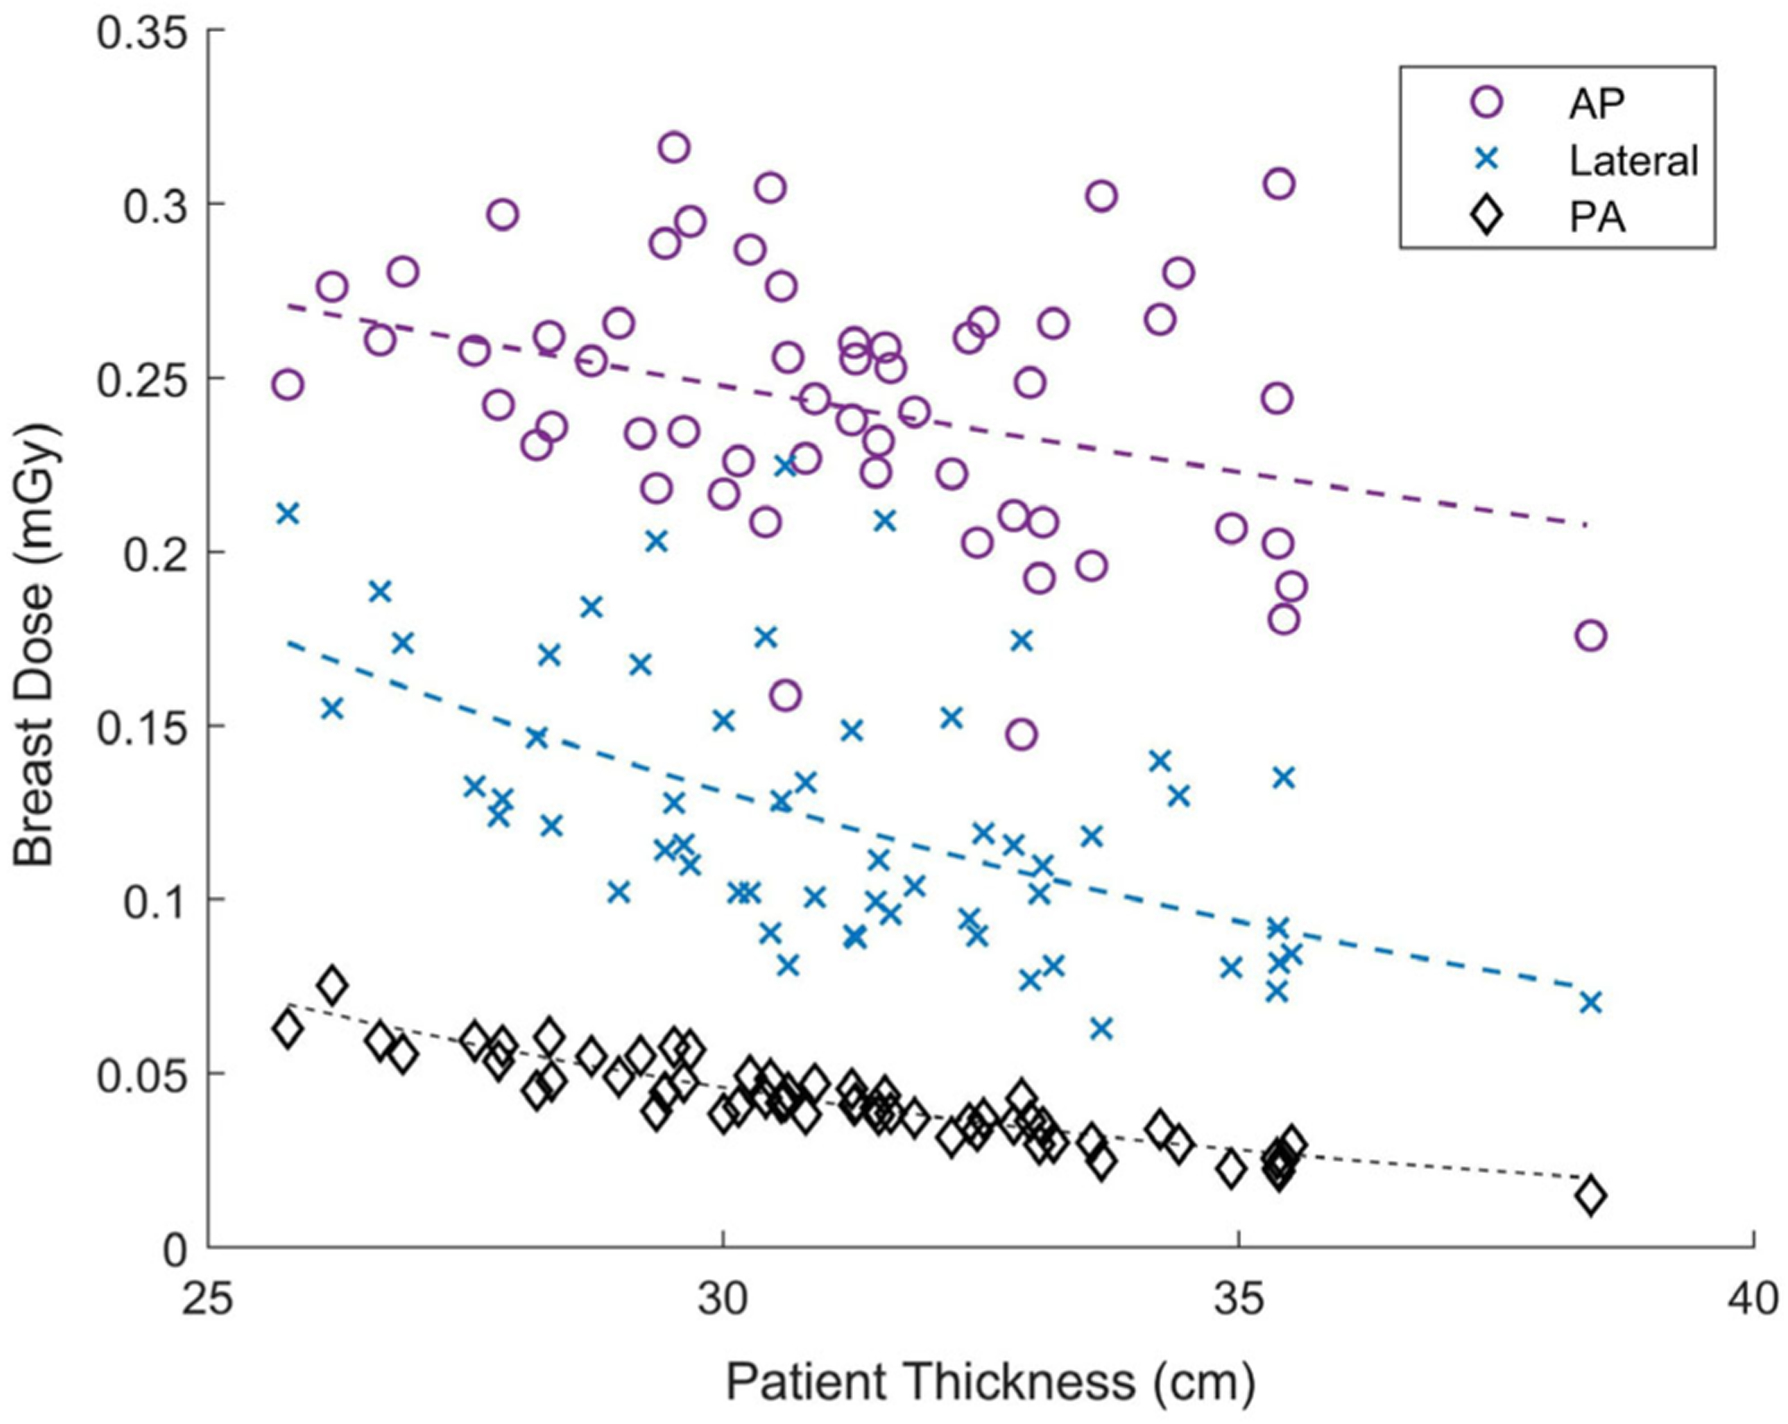
FIG. 3.

Breast dose (mGy) decreased exponentially for a population of patients (n = 57) for AP (circle), lateral (x), and PA (diamond) orientations. The exponential relationship with patient thickness explains most of the variation in breast dose for PA orientation, however, it does not explain as much of the variation for AP and lateral orientation. If results were used to predict future patient doses, the PA exponential relationship would result in more precise estimates of organ dose.
