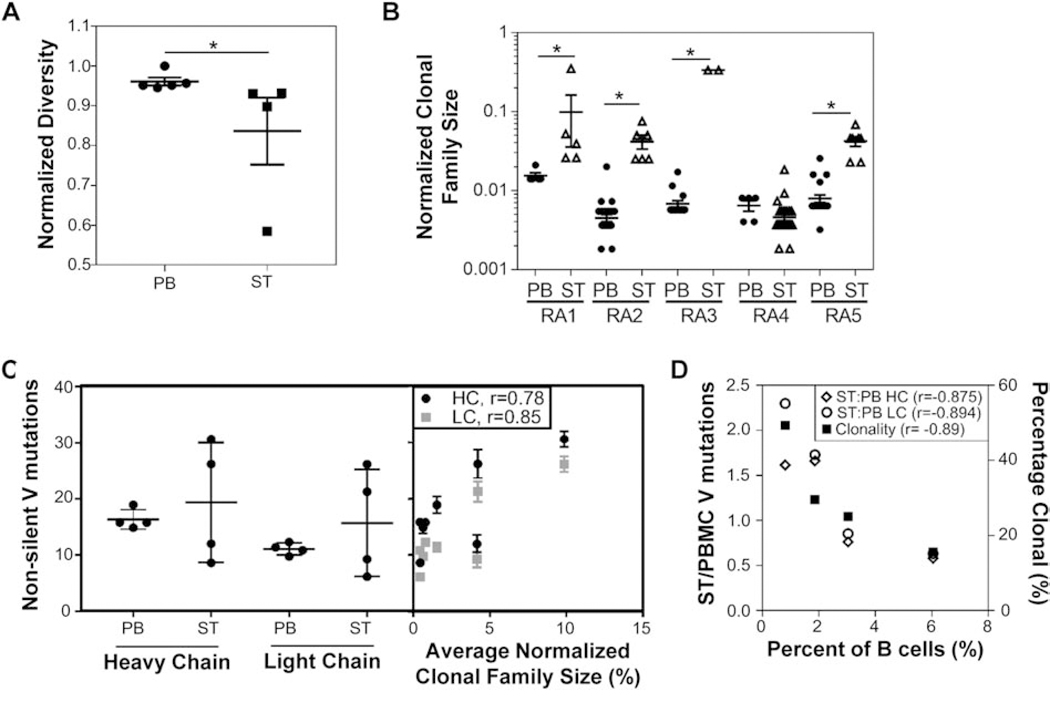
Fig. 2: The peripheral blood repertoire exhibits increased diversity with a reduced degree of clonal expansion.
(A) The diversity or fraction of unique clonotypes is higher among peripheral blood (PB)-derived (n = 5) sequences compared to synovial tissue (ST)-derived (n = 4) sequences. († - p < 0.05, Mann-Whitney U test). (B) ST-derived clonal families represent a larger portion of the total number of sequences isolated, as shown by the normalized clonal family size (i.e. number of members within a clonal expansion divided by the total number of sequences isolated). (* - p < 0.01, ANOVA followed by Sidak’s test compared to matched PB). (C) The average number of non-silent mutations is compared between PB and ST (left), highlighting a bifurcation in the subjects analyzed; however, this mutation rate significantly correlates with the average normalized clonal family size for each subject/tissue (right) (r – Pearson correlation coefficient). (D) The percent of B cells isolated from ST is compared with the ratio of V gene mutations in ST versus PB (left axis) and degree of clonality (right axis) for each sample. (r – Pearson correlation coefficient).

