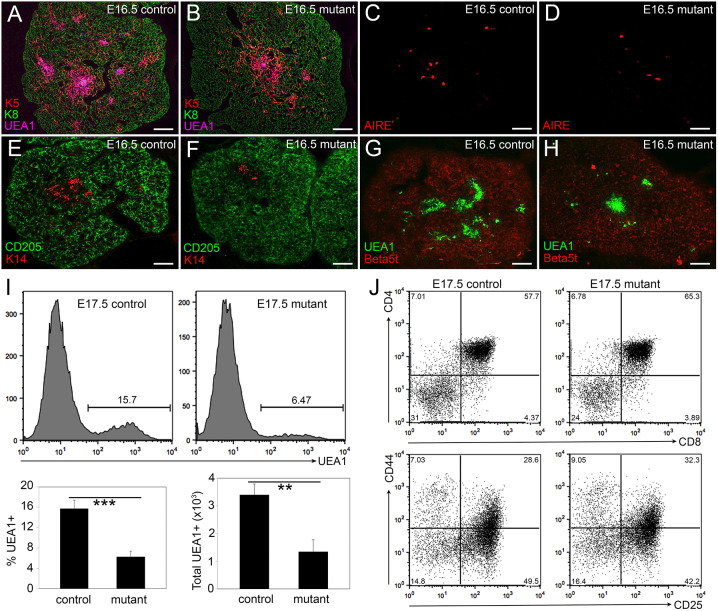
Fig. 3.
Notch1 deletion from TECs affects mTEC organization and differentiation. (A,B) Immunofluorescence of E16.5 Foxn1Cre;Notch1fx/fx mutant (B) and control (A) thymus for K5 (red), K8 (green) and UEA1 (magenta). (C,D) Immunofluorescence of E16.5 Foxn1Cre;Notch1fx/fx mutant (D) and control (C) thymus for AIRE. (E,F) Immunofluorescence of E16.5 Foxn1Cre;Notch1fx/fx mutant (F) and control (E) thymus for K14 (red) and CD205 (green). (G,H) Immunofluorescence of E16.5 Foxn1Cre;Notch1fx/fx mutant (H) and control (G) thymus for UEA1 (green) and β5t (red). (I) Flow cytometry showing histogram (top), percentage (bottom left) and total number (bottom right) of UEA1+ cells in Foxn1Cre;Notch1fx/fx mutant and control thymi at E17.5. (J) Flow cytometric analysis of intrathymic thymocytes from E17.5 Foxn1Cre;Notch1fx/fx mutant and control thymi stained for CD4, CD8, CD25 and CD44. Top panels show CD4 versus CD8; bottom panels show double-negative subsets with CD44 versus CD25. ***P≤0.001, **P≤0.005. n>3 for IHC; n>5 for flow cytometry. Scale bars: 50 µm.

