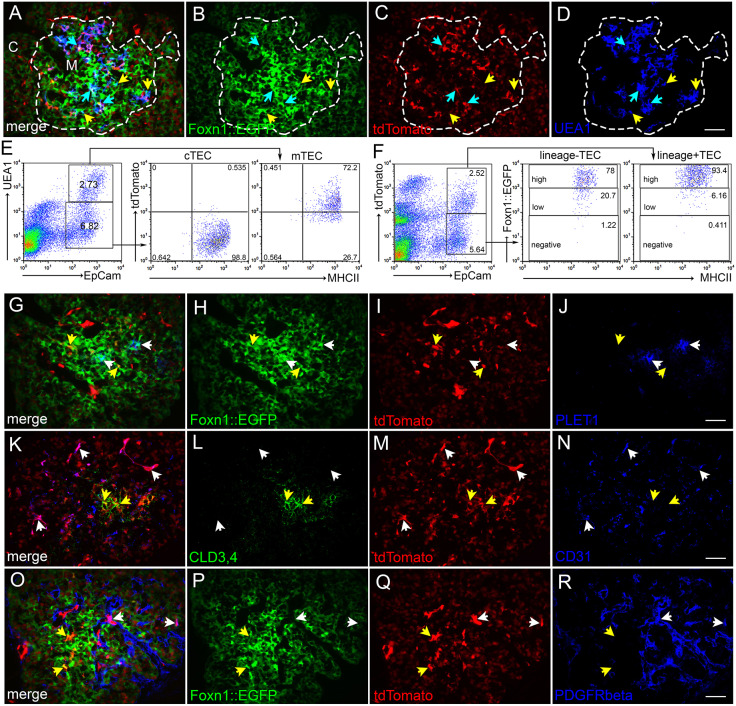
Fig. 9.
NOTCH1 signaling lineage tracing in TEPCs: N1IP::CreLO;tdTomato. (A-D) Immunofluorescence of E14.5 N1IP::CreLO;tdTomato;FOXN1::EGFP thymus for expression of FOXN1::EGFP (green; B), tdTomato (red; C) and UEA1 (blue; D). Dashed line outlines medulla. Cyan arrows, GFP+;tdTomato+;UEA1+ cells; yellow arrows, GFP+;tdTomato−;UEA1+ cells. (E) Flow cytometric analysis of newborn N1IP::CreLO;tdTomato thymus stained for EpCam, UEA1 and MHCII, showing percentage of UEA1+;MHCIIhi mTECs and UEA1−;MHCIIhi cTECs that express the N1IP::CreLO;tdTomato reporter. (F) Flow cytometric analysis of newborn N1IP::CreLO;tdTomato;FOXN1::EGFP thymus stained for EpCam and MHCII showing FOXN1::EGFP levels in the EpCam+;N1IP::CreLO;tdTomato+ and EpCam+;N1IP::CreLO;tdTomato− TEC populations. (G-J) Immunofluorescence of E14.5 N1IP::CreLO;tdTomato;FOXN1::EGFP thymus for FOXN1::EGFP (green; H), tdTomato (red; I) and PLET1 (blue; J). White arrows, GFP+;tdTomato−;PLET1+ TEPCs; yellow arrows, GFP+;tdTomato+;PLET1− TECs. (K-N) Immunofluorescence of E14.5 N1IP::CreLO;tdTomato thymus for CLD3,4 (green; L), tdTomato (red; M) and CD31 (blue; N). White arrows, CLD3,4−;tdTomato−;CD31+ endothelial cells; yellow arrows, CLD3,4+;tdTomato+;CD31− mTEPCs. (O-R) Immunofluorescence of E14.5 N1IP::CreLO;tdTomato; FOXN1::EGFP thymus for FOXN1::EGFP (green; P), tdTomato (red; Q) and PDGFR-β (blue; R). White arrows, GFP−;tdTomato+;PDGFR-β+ pericytes; yellow arrows, GFP+;tdTomato+;PDGFR-β− TECs. C, cortex. M, medulla. n>3 for IHC; n>5 for flow cytometry. Scale bars: 50 µm.

