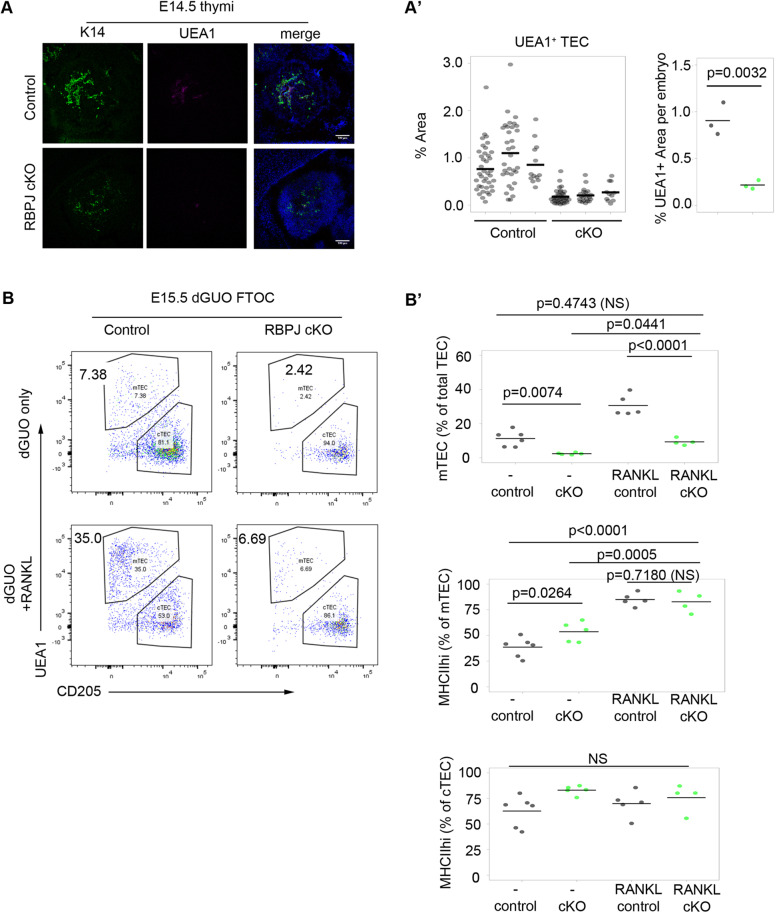
Fig. 3.
Notch is required prior to NF-κB signaling in early mTEC development. (A) Representative transverse sections of embryos of the genotype indicated showing the thymus primordium stained with the mTEC markers K14 and UEA1. DAPI reveals nuclei. (A′) Proportion of pixels in the thymic section (within the outline of DAPI) that stained positive for UEA1. Left plot shows data from each quantified section, grouped by embryo; right plot shows per embryo means from the left plot. (B,B′) E15.5 thymi of the genotypes shown were microdissected and cultured as FTOC for 3 days in dGUO and in the presence of absence of RANKL. (B) Representative plots showing cTEC/mTEC subset distribution after culture. The condition and genotype are as shown. (B′) Quantitation of the percentage of mTECs and the percentage of MHCII+ cells in mTEC and cTEC populations. (A,A′) UEA1 images are representative of data collected from 3 cKO and 3 littermate control embryos from 3 separate litters. K14 images are representative of data collected from 4 cKO and 4 control embryos from 4 separate litters. Embryos were snap frozen in OCT. cKO and control embryos were selected for analysis following genotyping. (A′) Left plot: each data point represents a section; right plot, each mean value represents the reconstruction of all thymus-containing sections of an embryo. (B) E15.5 thymi from three litters from a Foxn1Cre;RbpjFL/+×RbpjFL/FL cross were cultured with or without RANKL. Litters were obtained and cultured on different days. Genotypes for each embryo were determined retrospectively. No samples were excluded from the analysis and graphs show all datapoints obtained. For each condition, each n represents the thymic lobes from a single embryo; dGuo control, n=6; dGuo cKO, n=5; RANKL control, n=5; RANKL cKO, n=4. (A′) P values in pairwise comparisons were calculated with a two-tailed t-test. (B′) P values were calculated using a one-way ANOVA test (two tailed).

