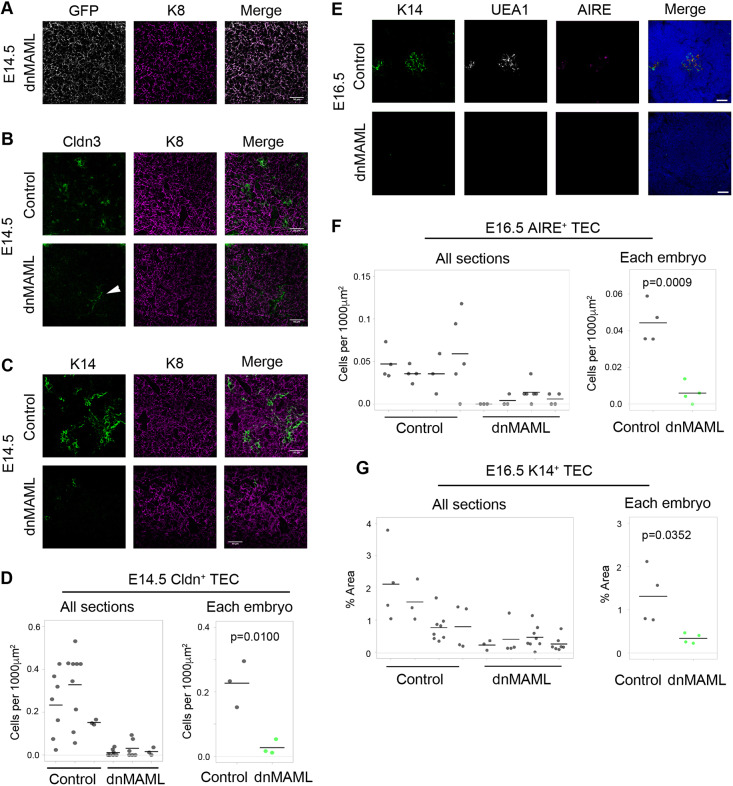
Fig. 4.
Notch signaling is an essential mediator of mTEC specification. (A-C) Representative images of thymi showing (A) the overlap between GFP (recombined cells) and K8 (TECs), and (B,C) staining for mTEC progenitor marker claudin 3 (CLDN3; B), the mTEC marker K14 (C) and epithelial marker K8. Age and genotype are as shown. Scale bars: 50 μm. (D) Quantification of CLDN3+ TECs in E14.5 control and dnMAML thymi. Some weakly stained CLDN3+ cells colocalized with the endothelial marker CD31 (white arrowhead in B; see also Fig. S7A); hence, for quantification, only CLDN3+K8+ double-positive cells were counted. (E) Representative images of E16.5 thymi stained for DAPI, UEA1, K14 and AIRE. Scale bars: 50 μm. (F,G) Quantification of AIRE+ mTECs as assessed by an unbiased automated counting protocol (F) and of K14+ staining (area of marker over the positive threshold/area of thymus defined by DAPI staining) (G) in E16.5 control and dnMAML thymi. Foxa2T2iCre;Rosa26loxp-STOP-loxp-dnMAML-IRES-eGFP and Foxa2T2iCre;Gt(ROSA)26Sortm1(EYFP)Cos (control) embryos were collected at E14.5 and E16.5. Samples analyzed were littermates. (D,F,G) Each data point represents a section. Mean values from all sections analyzed from the same embryo were used for statistics. E14.5, n=3; E16.5, n=4 embryos. P values were calculated with a two-tailed unpaired t-test.

