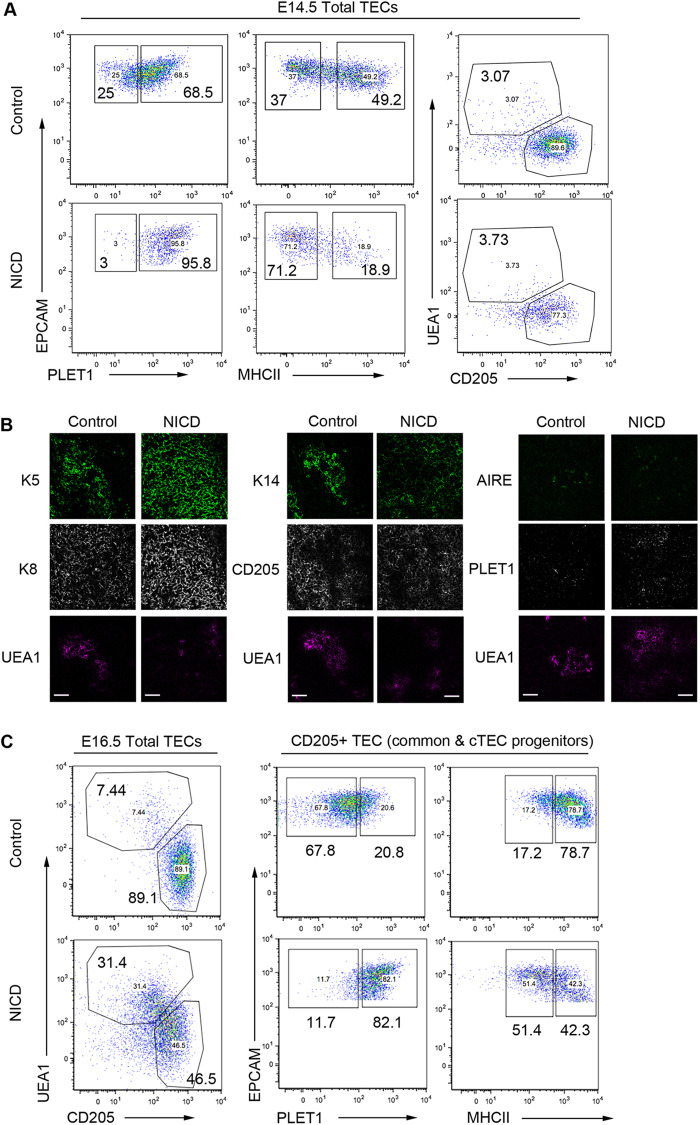
Fig. 5.
Outcome of enforced Notch signaling in TEC. (A) (Left and middle) Representative plots showing E14.5 EpCAM+ TEC stained with markers of early progenitor TECs (PLET1), TEC differentiation [MHC class II (MHCII)], mTEC (UEA1) and cTEC (CD205). (Right) Proportions of PLET1+MHCII−, PLET1+MHCII+, PLET1−MHCII− and PLET1−MHCII+ TEC in 3 independent E14.5 control and NICD thymi, revealing over-representation of undifferentiated PLET1+ TEC and under-representation of differentiated MHCII+ TECs in NICD thymi. (B) E16.5 control and NICD thymi stained with the markers shown. Uniform K5+ K8+ epithelium (left) and expansion of K14 staining into CD205+ regions (middle) in NICD compared with clearly demarcated K14+ and CD205+ zones in controls (right). Both control and NICD thymi express AIRE in UEA1+ areas. PLET1 expression is broader in NICD than in controls. Scale bars: 50 μm. (C) Representative plots showing TEC subset distribution in E16.5 thymi after staining for the markers shown. Data after gating on EPCAM+ cells (left) and after gating on CD205+ cTECs/common TEPCs (right). Foxn1Cre;R26LSL-NICD-EGFP and C57BL/6 control embryos were collected at E14.5 and E16.5. Samples analyzed were from the same litter. E14.5 NICD, n=4; E14.5 control, n=3; E16.5 NICD, n=3; E16.5 control, n=3. (B) Images are representative of analysis of thymi from two E16.5 NICD and two control embryos.

