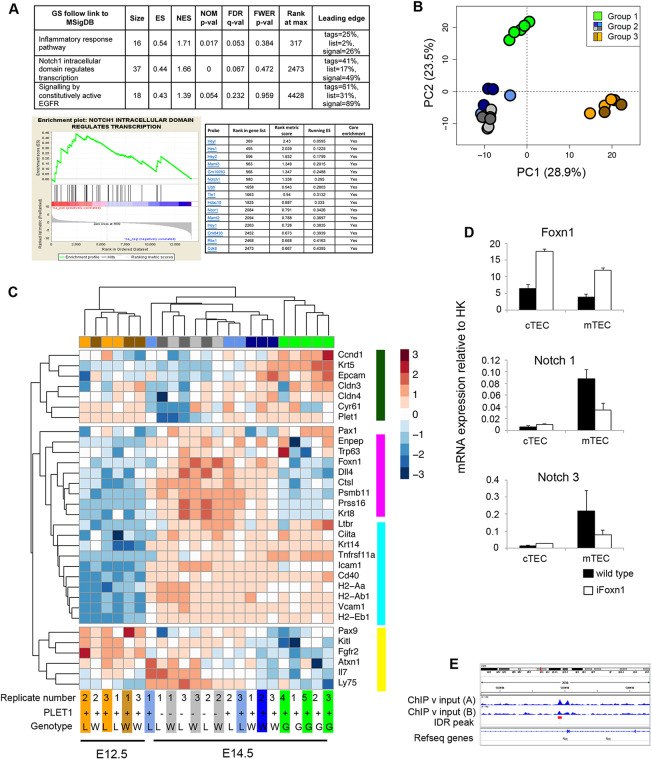
Fig. 6.
Transcriptome analysis of Notch loss- and gain-of-function mutants. (A) Pathway analysis of the E14.5 NICD and E14.5 controls identified three signaling pathways as enriched (FDR≤0.25) in E14.5 NICD versus E14.5 control thymi (top). GSEA enrichment plot for the Notch signaling pathway (bottom left). Leading edge subset genes contributing to the enrichment for Notch signaling pathway (bottom right). (B) PCA of Rbpj cKO, wild-type and NICD TECs at the ages shown (500 most variable genes). Group 1, E14.5 NICD samples; group 2, E14.5 PLET1+ and PLET1− Rbpj cKO and controls; and group 3, E12.5 Rbpj cKO and controls. (C) Heatmap of lineage-specific genes among all groups of samples shown in the PCA above. Colors at the top and bottom of the heatmap indicate clustering of samples per group, while side colors indicate groups of genes regulated similarly across all conditions. Groups: E12.5 wild type, brown; E12.5 Rbpj cKO, orange; E14.5 wild-type PLET1+, dark blue; E14.5 wild-type PLET1−, light gray; E14.5 Rbpj cKO PLET1+, light blue; E14.5 Rbpj cKO PLET1−, dark gray; W, wild type; L, loss of function (Rbpj cKO); G, gain of function (NICD). (D) RT-qPCR analysis of sorted cTECs and mTECs from E17.5 wild-type and iFoxn1 thymi for the genes shown. Data are mean±s.d. (E) Genomic locus of Rbpj showing Foxn1 peaks identified by Zuklys et al. (2016). (A-C) To obtain the E12.5 and E14.5 cKO and wild-type samples, thymi were microdissected from E12.5 and E14.5 embryos generated from a Foxn1Cre;RbpjFL/+×RbpjFL/FL cross and TECs were obtained by flow cytometric cell sorting. Following genotyping, cells from three cKO and three control samples were processed for sequencing. The E12.5 and E14.5 samples were each obtained from two separate litters, on two separate days for each timepoint. To obtain the E14.5 NICD samples, thymi were microdissected from five E14.5 Foxn1Cre; R26LSL-NICD-EGFP embryos of the same litter, TECs were obtained by flow cytometric cell sorting and the samples processed for sequencing. (D) n=3, where each n represents TECs sorted from pooled embryos from a single litter of E17.5 iFoxn1 or wild-type embryos.

