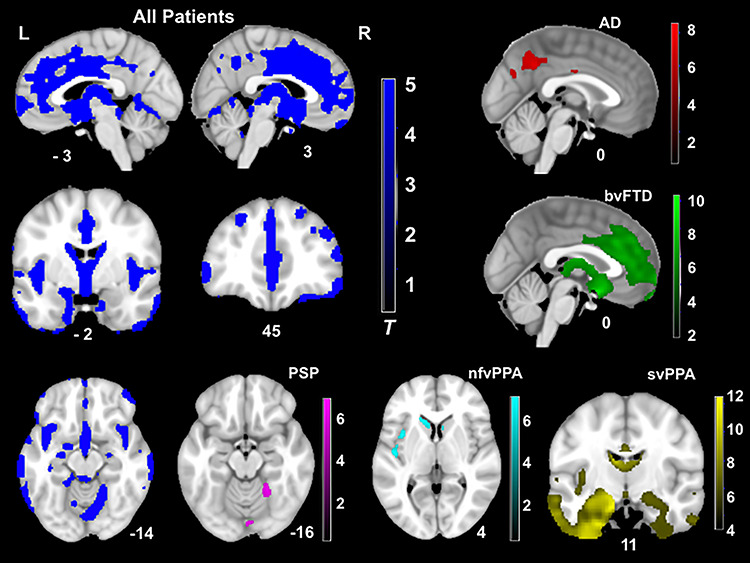
Fig. 2.

T-score maps of brain areas for which volume loss was greater than HCs, when controlling for age, gender, handedness, total intracranial volume and scanner field strength (PFWE < 0.05). Compared to controls, the patient group had smaller volume in the frontal (e.g. medial prefrontal and orbitofrontal cortex, anterior cingulate cortex and insula), striatum and temporal (e.g. caudate, putamen, amygdala and hippocampus) and parietal regions (e.g. precuneus). Thus, patients altogether showed a widespread pattern of neurodegeneration. The CBS group did not show significant volume loss compared to controls at this threshold.
