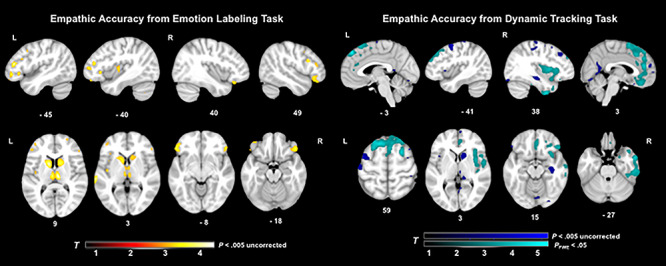
Fig. 3.

T-score maps of brain areas for which volume loss was associated with worse emotion perception on the emotion labeling film task and dynamic tracking task, when controlling for diagnosis, age, gender, handedness, disease severity, cognitive functioning, total intracranial volume and scanner field strength. Smaller volume (maximum T-score = 4.16) in bilateral inferior frontal, bilateral caudate, bilateral thalamus and left insula regions was associated with worse emotion labeling (P < 0.005, uncorrected). Smaller volume (maximum T-score = 5.22) in bilateral and predominantly right medial frontal, right anterior and middle temporal, right insular and bilateral cingulate and pre- and post-central gyri regions was associated with worse emotion perception (P < 0.005, uncorrected). Two large clusters in superior medial frontal and right anterior temporal and insular areas were also significant with family wise error correction (PFWE < 0.05) for the dynamic tracking task.
