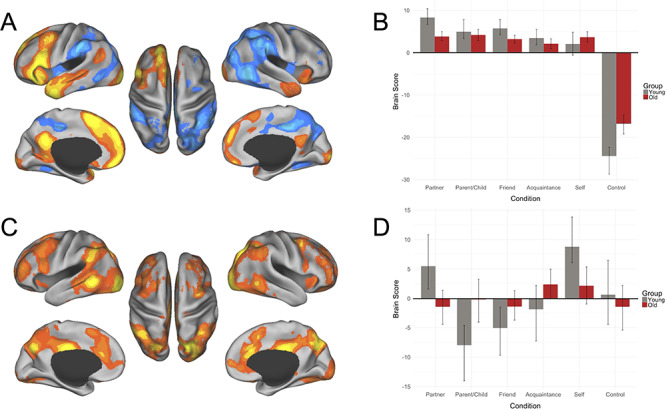
Fig. 2.

Results of the task PLS analysis. (A) LV1 activation map, (B) LV1 brain scores, (C) LV2 activation map and (D) LV2 brain scores. PLS analysis for young (gray bars) and older (dark red bars) adults contrasted activity across partner, parent or child, close friend, familiar acquaintance, self and control conditions. Warm colors (shades of orange and yellow) on activation maps correspond to positive brain scores, shown by the plotted bars above zero. Cool colors (shades of blue) on activation maps correspond to negative brain scores, shown by the plotted bars below zero. Brain scores represent the cross product of the group result image and the individual subject BOLD response for each given LV. For activation maps, (left) lateral and medial views of left hemisphere, (center) dorsal view, (right) lateral and medial views of right hemisphere. Error bars represent 95% confidence intervals.
