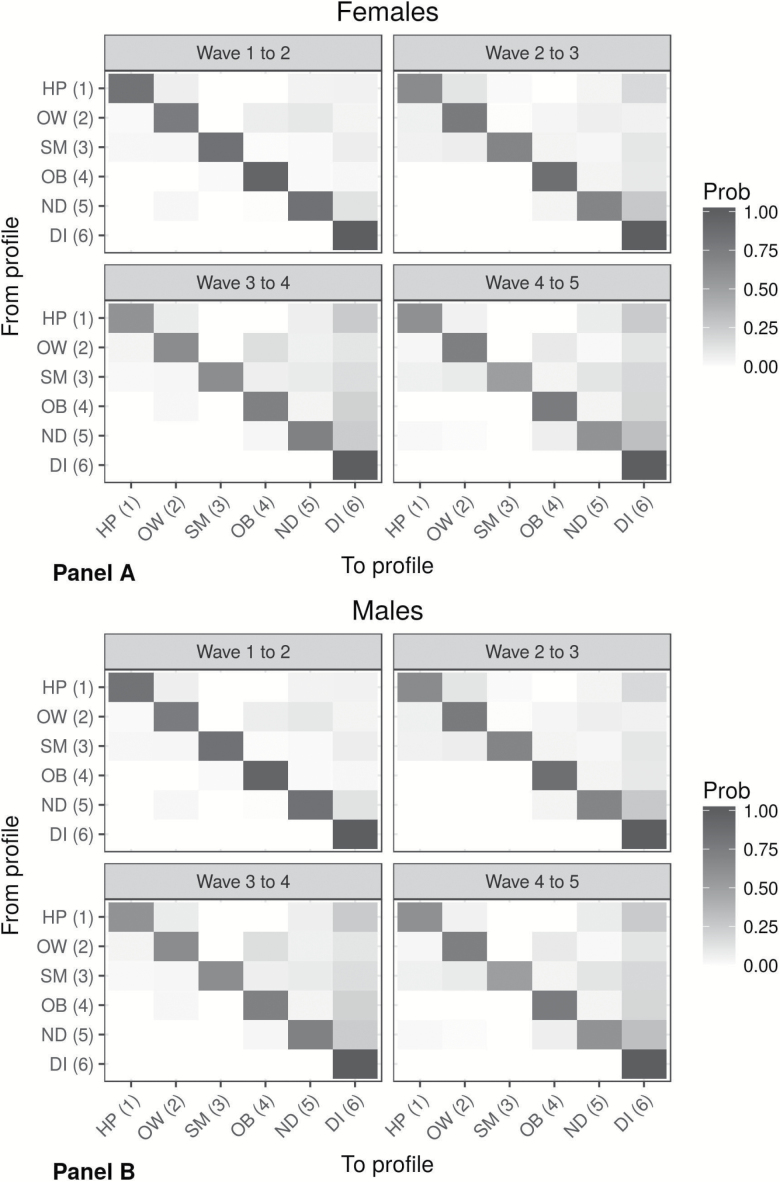
Figure 2.
Heat maps of transitions between health behavior profiles from wave to wave by sex (Profile 1: “health promoting—normal BMI, moderate drinkers,” Profile 2: “overweight,” Profile 3: “current smokers,” Profile 4: “obese,” Profile 5: “normal or overweight nondrinkers,” Profile 6: “deceased”).

