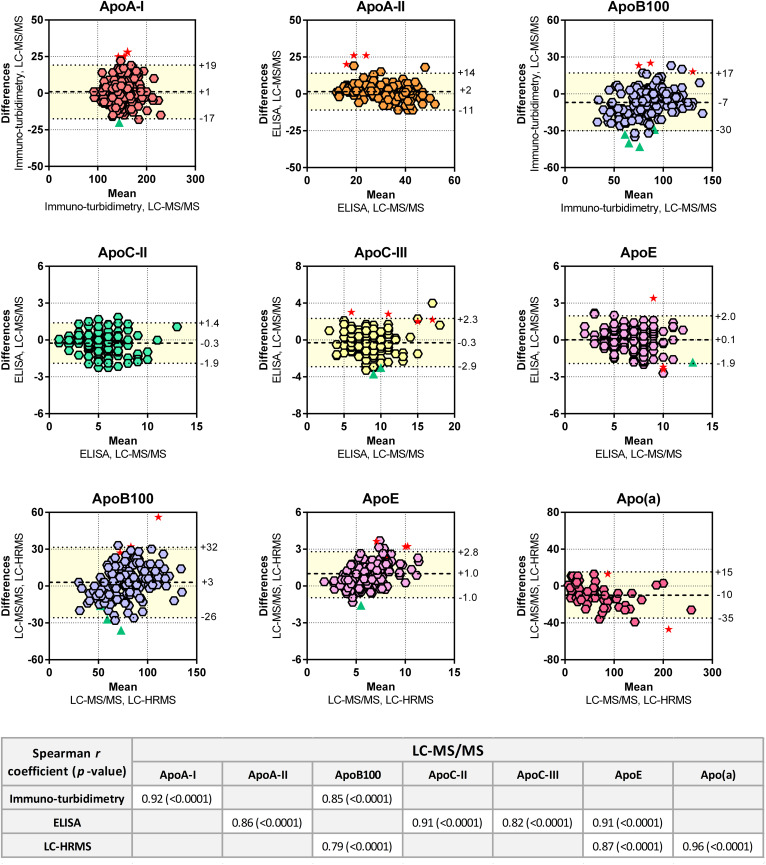
Fig. 4.
Cross-validation of the LC-MS/MS assay with other techniques. Bland-Altman plots and Spearman correlations were generated to test the similarity of various methods (n = 160). For the Bland-Altman plots, the difference of values (y axis) obtained from two methods was plotted according to the average value obtained by two methods. The mean difference and the limits of agreement (colored area), corresponding to the 95% confidence level (i.e., mean ± 1.96 × standard deviation), are represented. Red stars indicate hemolyzed plasma samples. Green triangles indicate opalescent plasma samples. Spearman correlations between LC-MS/MS and other methods are indicated.

