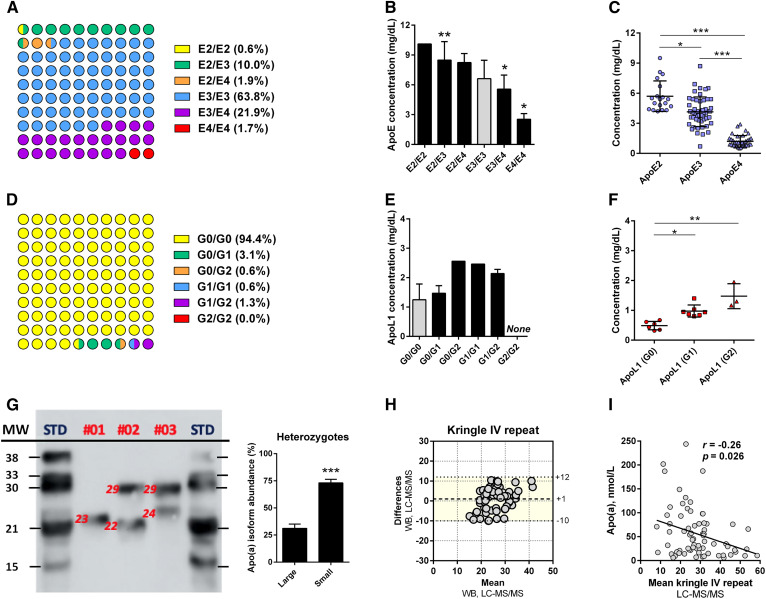
Fig. 5.
LC-MS/MS analysis of apoE, apoL1, and apo(a) polymorphisms. A: Distribution of the apoE phenotype was determined by LC-MS/MS and LC-HRMS (100% agreement). B, C: Influence of the apoE phenotype on the total apoE plasma concentration and the plasma concentrations of the apoE isoforms in heterozygous patients (E2/E3, E2/E4, and E3/E4). D: Distribution of the apoL1 phenotype as determined by LC-MS/MS. E, F: Influence of the apoL1 phenotype on the total apoL1 plasma concentration and the plasma concentrations of the apoL1 isoforms in heterozygous patients (G0/G1, G0/G2, and G1/G2). G: Determination of apo(a) polymorphic sizes [kringle IV (KrIV) repeats] by Western blot. H: Bland-Altman plots were generated to test the similarity of LC-MS/MS and Western blot for the determination of the apo(a) polymorphic size (n = 71, LC-MS/MS detectable values). The mean difference and the limits of agreement (colored area), corresponding to the 95% confidence level (i.e., mean ± 1.96 × standard deviation), are represented. I: Influence of the apo(a) polymorphic size on the apo(a) plasma concentration (Spearman’s test). *P < 0.05, **P < 0.01, ***P < 0.001 (Kruskal-Wallis test). For B and E, the plasma concentrations were compared with the healthy phenotypes (i.e., E3/E3 or G0/G0).

