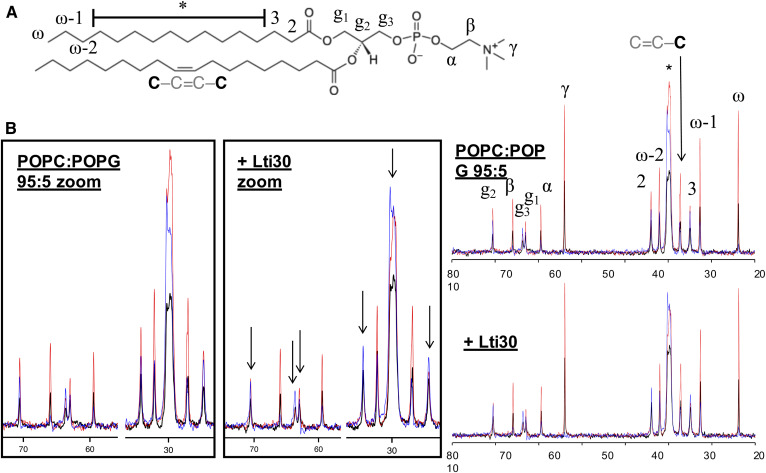
Fig. 2.
A: Chemical structure of POPC with numbered segments. B: 13C DP-CP-rINEPT spectra of the POPC:POPG (95:5) lamellar phase in the presence and absence of Lti30, with zoom-in pictures on the spectral regimes 22–35 ppm and 58–72 ppm. Arrows indicate peaks corresponding to the lipid carbons that are clearly affected by the addition of Lti30. Each graph shows three spectra: CP, blue; DP, black; and rINEPT, red.

