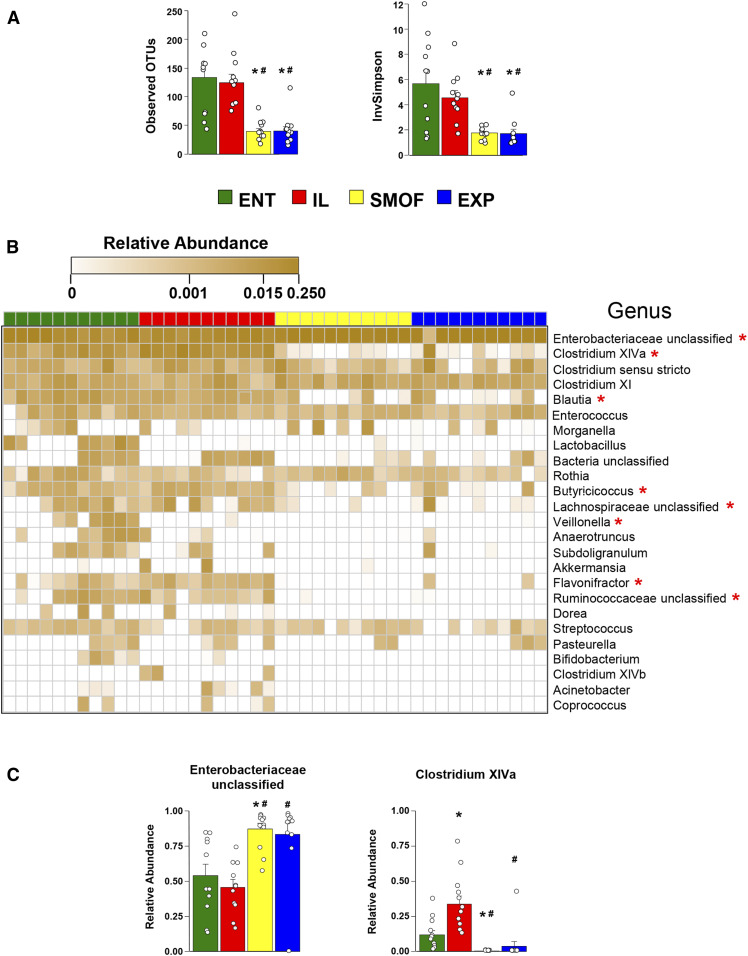
Fig. 4.
Characterization of the colonic microbiota profile. (A) Mean OTU counts and the inverse of Simpson’s Diversity Index across the treatment groups. Bars represent standard error. *P < 0.05 versus ENT, #P < 0.05 versus IL (Holm-adjusted pairwise t-tests). B: Heatmap showing profiles of observed bacteria at the genus level (clustered at 97% sequence identity) and arrayed horizontally according to treatment group and vertically by decreasing overall abundance in the dataset. Values are sample-wise proportional abundances. *P < 0.05 (Holm-adjusted Kruskal-Wallis rank sum tests). C: Group-wise comparison of the top two most abundant taxa. Bars represent standard error. *P < 0.05 versus ENT, #P < 0.05 versus IL (Holm-adjusted pairwise t-tests).

