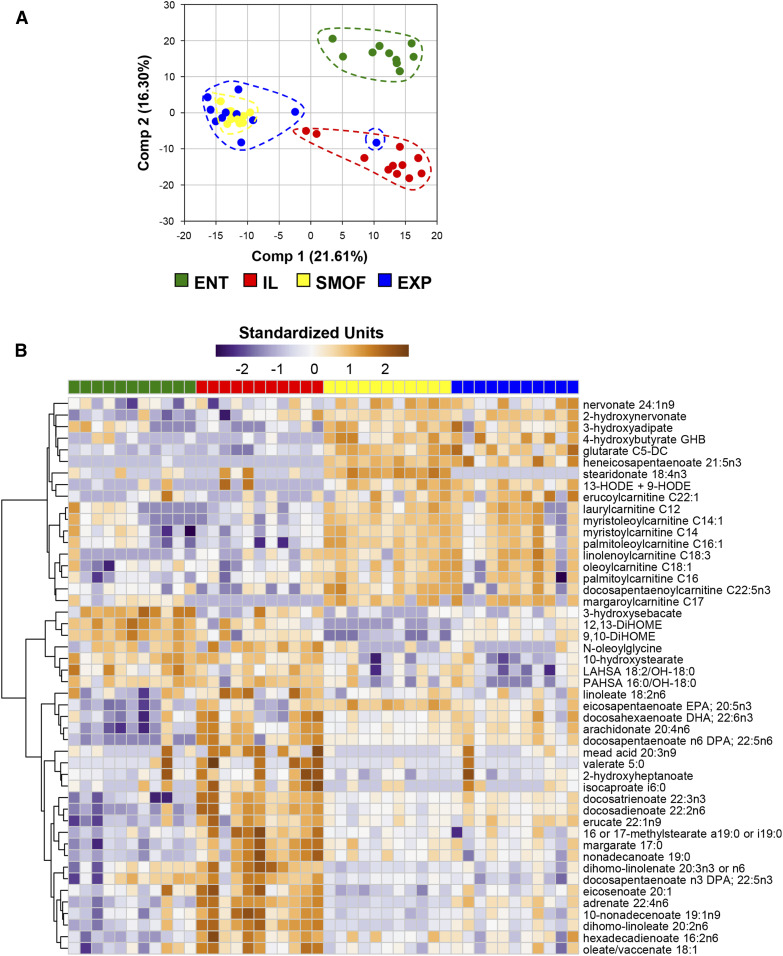
Fig. 5.
Characterization of colonic luminal metabolite profiles. A: Principal components plot with samples from individual pigs represented by a single dot. B: Heatmap showing profiles of FAs, which were observed to be significant at P < 0.05 (Benjamini-Hochberg-adjusted ANOVA) and have a median fold difference of >2 between SMOF and IL groups. The individual FAs are arranged by hierarchical clustering. Values are relative standardized units (dimensionless).

