
Fig. 2.
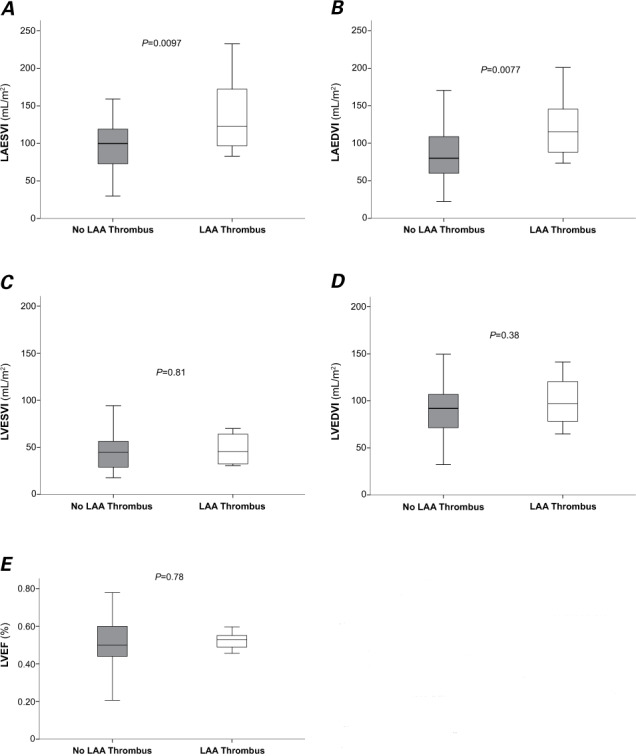
Box and whisker plots compare the estimated values for cardiac volumetric parameters derived from cardiac computed tomograms in patients with versus without left atrial appendage (LAA) thrombus: A) left atrial end-systolic volume index (LAESVI); B) left atrial end-diastolic volume index (LAEDVI); C) left ventricular end-systolic volume index (LVESVI); D) left ventricular end-diastolic volume index (LVEDVI); and E) left ventricular ejection fraction (LVEF). The line inside a box marks the median (50th percentile). The bottom and top of a box mark the interval between the 25th and 75th percentiles. Whiskers indicate the interval between the minimum and maximum values, excluding the 4 outlier values for each. P <0.05 (2-sided) was considered statistically significant.