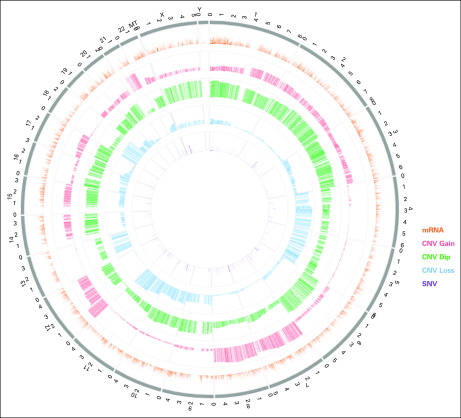
FIG 6.
Representative visualization of high-level genomic data summary. The circos plot was generated for The Cancer Genomic Atlas Testicular Germ Cell Tumor data (N = 156). The circles from inside to outside stand for single-nucleotide variant (SNV) frequency (log transformed), copy-number variant (CNV) loss, CNV diploid (dip), CNV gain, mRNA expression, and chromosome location.

