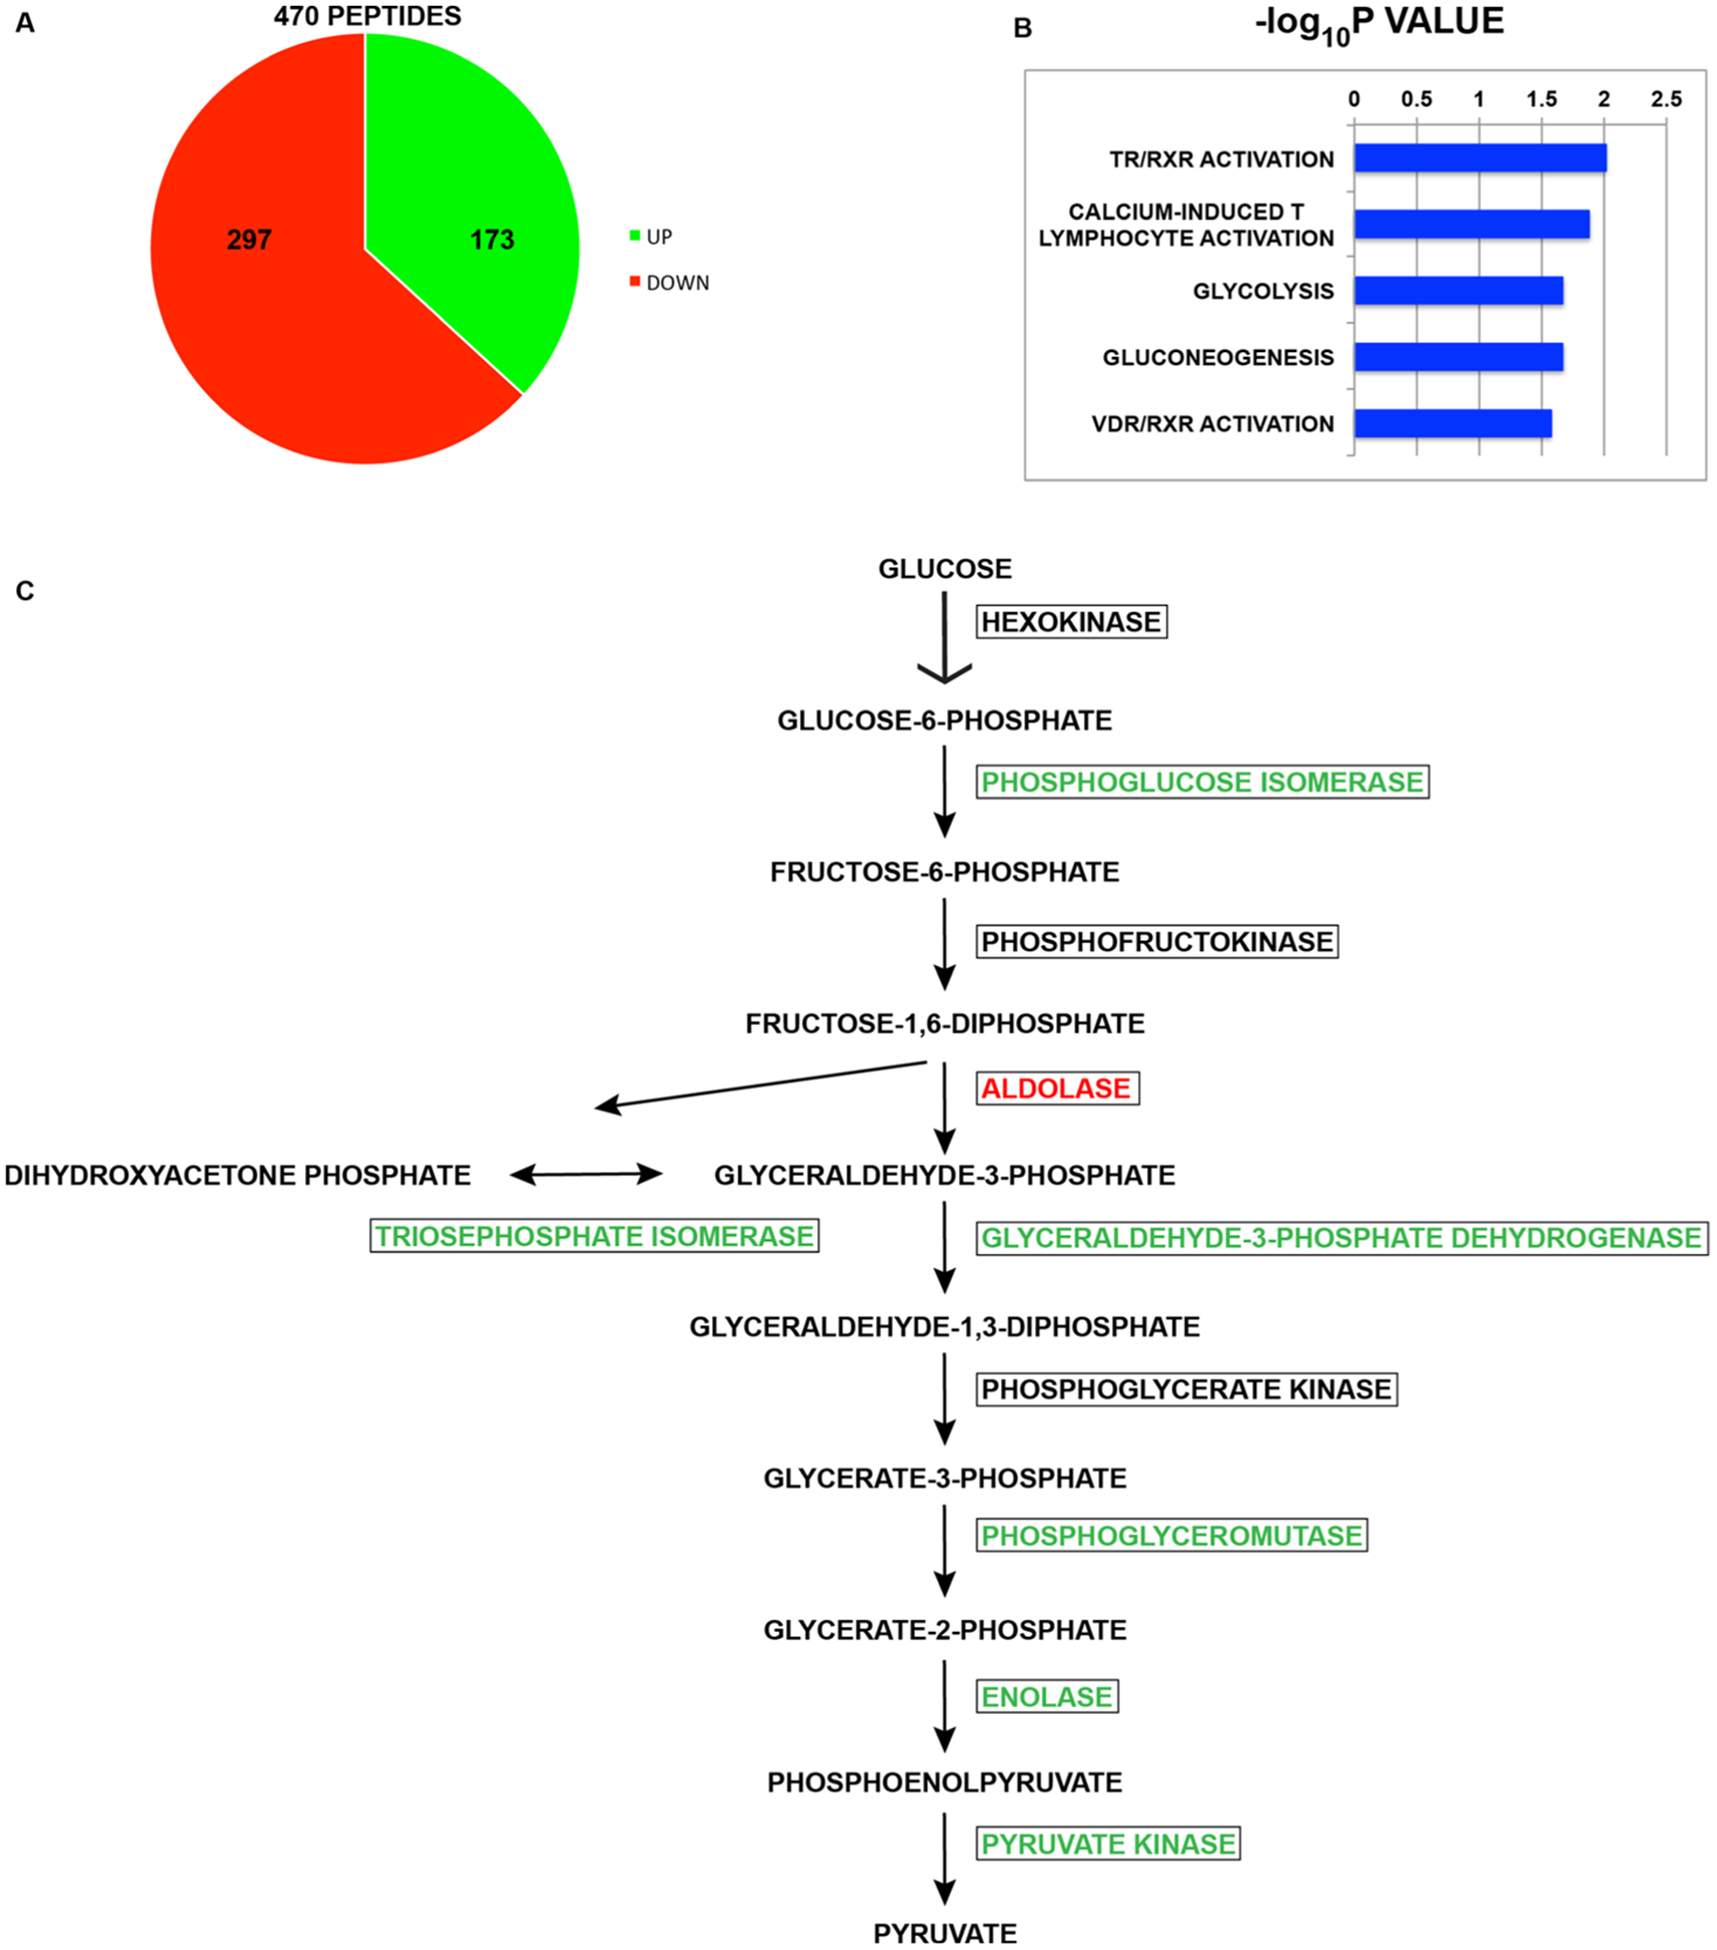
Figure 1.

Effect of the carbon source on the mouse acetylome. (A) Pie chart showing the number of sites of lysine acetylation that increase or decrease when MEFs are switched from growth in glucose-containing media to galactose-containing media. (B) Ingenuity pathway analysis of the proteins whose acetylation changed by at least 2.5-fold between growth on glucose and galactose. The list of all peptides detected was used as the reference set. (C) Schematic diagram of the pathway of glycolysis. Enzymes in green increased at least 2.5-fold when cells on galactose, enzymes in red decreased at least 2.5-fold on galactose, and enzymes in black were unchanged.
